
Show Me the (Place) Love...
Quantifying "Livability" - the X-Factor in Amazon's Quest for "The One"
Place-lovers, city-nerds, urban datageeks - by now you all know that Amazon has entered Phase II of its Eharmony-for-cities quest for "the one," announcing the 20 cities still in the running for a "rose" (c'mon, you know you want a city-themed Bachelorette show as much as we do! ;)). Putting aside the disappointment of the "rose-less" 218 cities (for now - we feel ya Detroit, et. al. and will get back to this issue in a forthcoming blog), the question is, how will Amazon decide which city is right for them?
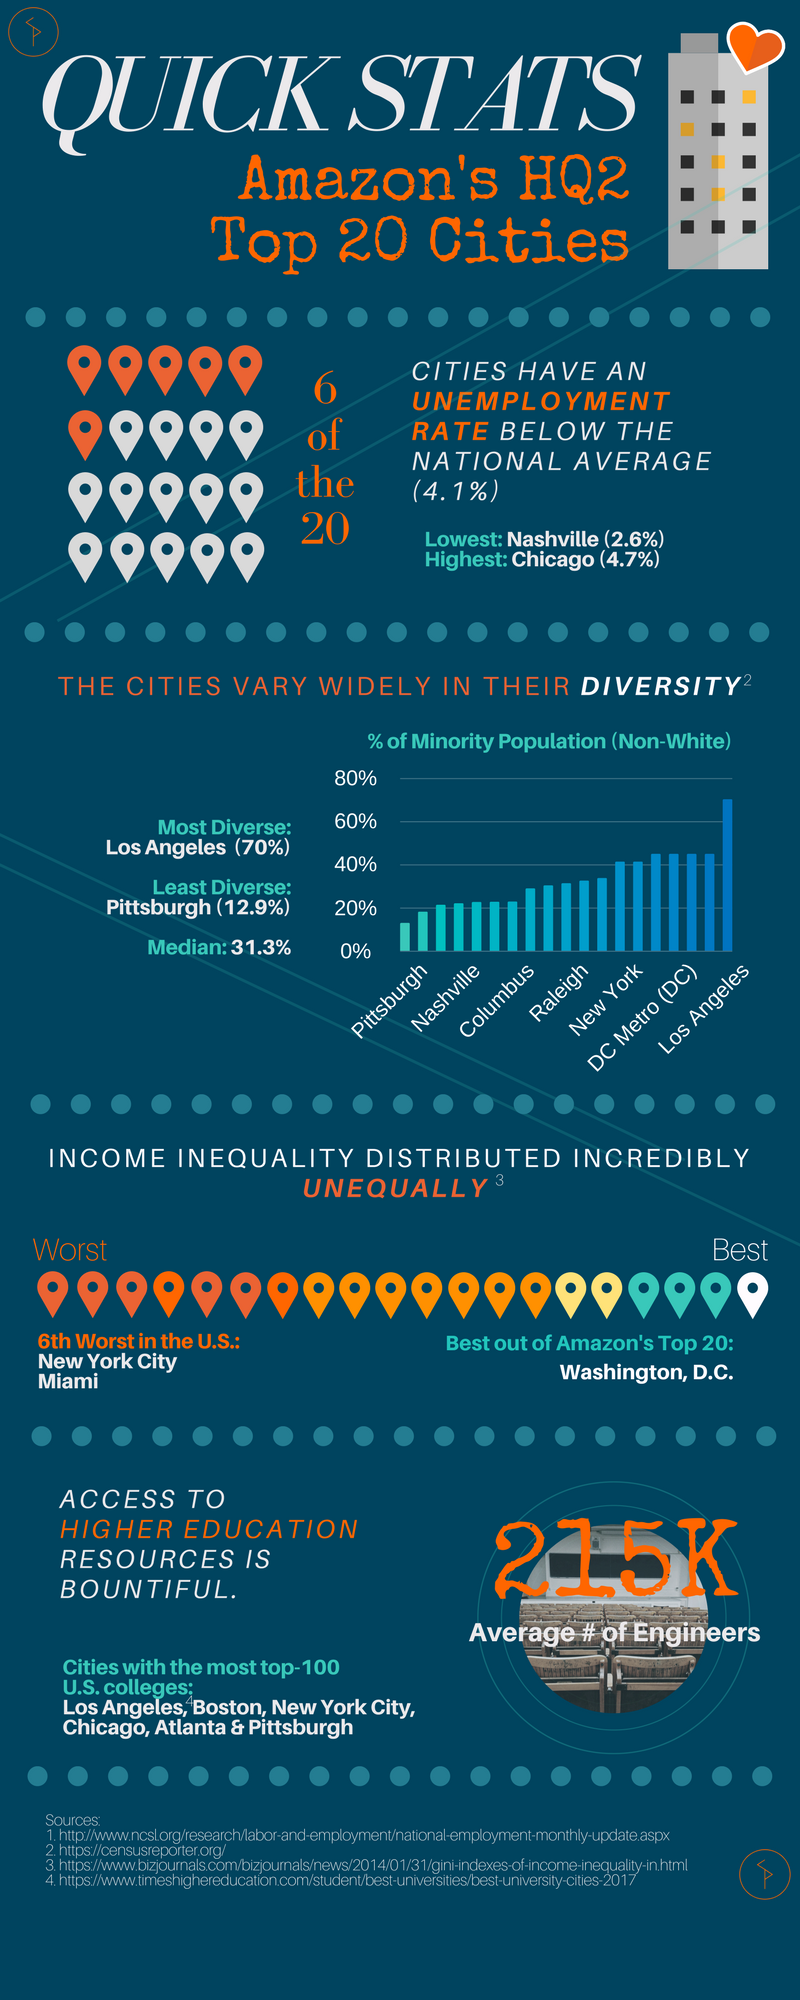
Well, no surprise, seems like everyone from the likes of CNN to Vegas bloggers are throwing their hats in the ring and putting together lists and lists of lists to predict which city will be Amazon's forever match. Since we like to crunch numbers more than rank for ranking's sake, we did a first take assessment of the "dating pool" to see what the cities had in common, especially with respect to one of the factors that's on Amazon's Perfect 10 desire list: a talented, diverse, creative labor pool. Check out (and share) this handy infographic below. But what we were particularly interested in is how Amazon will truly evaluate its livability requirement...Obvi, we have the exact tool for this job, quantifying what people love about cities is kinda our jam, but read on for a fun - datageeky - Prime(r) (hehe) on putting a number on place quality and quality of life (aka livability).
It's the Livability, Stupid
We could not have been more excited to read Pete Saunders' Forbes article pointing out that the “livability” cut has not been made yet! Yeah, ya think!? Here at State of Place, we know a thing or two about “livability,” most notably - it’s really hard to quantify. Based on 15+ years of evidence, we’ve developed a robust and data-driven way to quantify walkability and livability, and we’d love to tackle this problem for you, Amazon (contact us!). But in the meantime, we used publicly available data to conduct our own "macro" livability analysis the way that Amazon is probably doing it. In the Amazon HQ2 RFP, there are a handful of quality of life metrics requested of the applicants:
- Crime
- Cost of living
- Traffic congestion
- Mass transit
While there are many more "micro-scale" factors that make a place lovable and livable (we collect 290 of these built environment factors), let's use these four metrics as a starting point to analyze the livability of the 20 top cities. (Due to data availability and consistency, we'll exclude Toronto from this analysis.)
First, let’s ASsess the Violent Crime Rate in each city:

Nine cities have a Violent Crime Rate above the median value. Removing those from the "dating pool", we’re left with the following cities:
- Montgomery County
- Austin
- Raleigh
- Columbus
- New York City
- Northern Virginia
- Denver
- Boston
- Los Angeles
- Dallas
Now let’s consider the Cost of Living in each city
We kept all the cities on the map in case you’re curious.

From our list of ten remaining cities, we’ll keep the five cities with the lowest cost of living (cheap dates!):
- Dallas
- Columbus
- Austin
- Raleigh
- Denver
Now, How about that traffic congestion:

From our remaining five cities, we’ll keep the top three cities with the lowest traffic congestion (I seriously knew people in LA that wouldn't date people further than a 20 min drive...traffic can be a buzzkill!):
- Raleigh
- Columbus
- Denver
And last but not least, Transit Accessibility:

It's not just traffic congestion, can't tell you how many NYC romances have died due to the need to gasp, transfer lines! Access matters...Soooo, from our remaining three cities, the city that had the best transit score was....drumroll...
- Denver, will you accept this rose?! (incidentally, this is the city that won over Detroit in our original Amazon analysis!)
A Rose By Any Other Name
Ok, so let's say you didn't want to just elimi-date cities just because they didn't make the first initial cut and you wanted to consider the "full-package." Well, another way to analyze this data is to give each measure an equal weight to determine which cities consistently rank at the top. Combining each city’s ranking within the four “livability” measures we chose, here's how the cities rank:
- Columbus
- Pittsburgh
- Raleigh
- Austin
- Montgomery County
- Denver
- Boston
- Dallas
- Indianapolis
- Philadelphia
- Northern Virginia
- Nashville
- New York City
- Chicago
- Miami
- Atlanta
- Newark
- Washington
- Los Angeles
Tinder Superficiality vs Eharmony INTIMACY: why Firms & Cities need the latter...
Quantifying and measuring livability is obviously a complex and nuanced problem. There's a fair amount of publicly available data at the city level that Amazon can use to find out how cities stack up in terms of quality of life. But, how do you combine livability with the other factors Amazon wants from a mate? And, how can you assess the lovability of a city from a purely 30,000ft analysis (which is what you get from macro data)? You CAN'T. You gotta get in the trenches. You gotta build intimacy with these cities...because....
To truly measure quality of place, livability, LOVABILITY - to find your perfect city match - you really need "micro-scale" data, at the block level, that lets you understand a place's touch, see, and feel - the things that people love about of cities. CLICK TO TWEET THIS!
The good news is - that's our specialty! Here’s a peek at some of the data we have on the walkability and livability of Downtown Washington, D.C.:


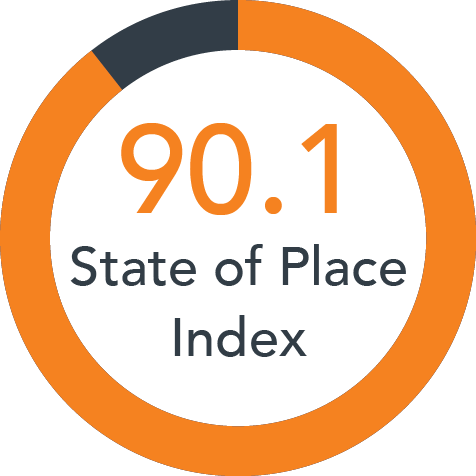
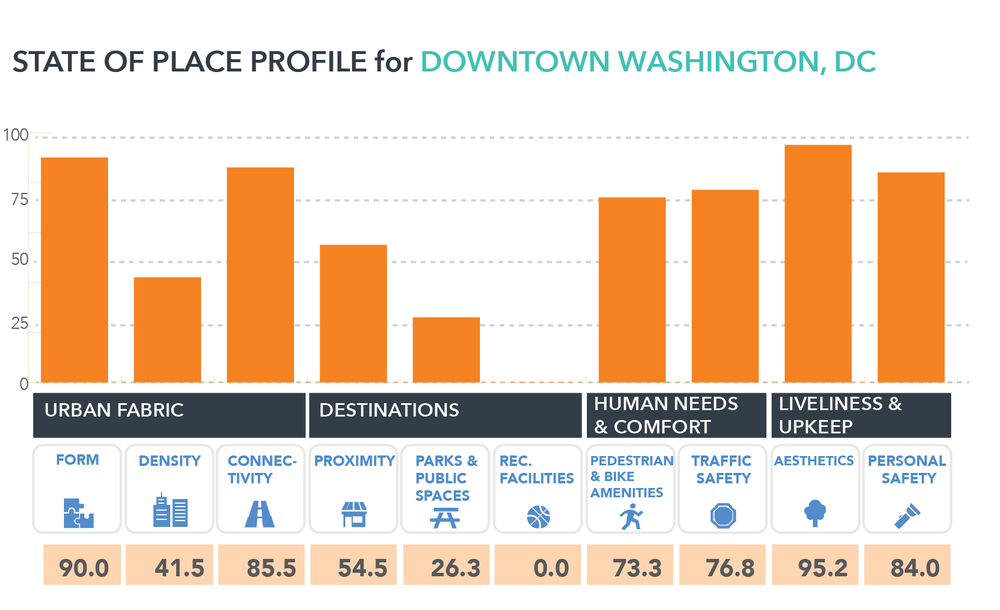
You not only get the benefit of comparing one block's (or group of block's) State of Place Index against others (vs. a high-level assessment of an entire city), you can see the breakdown of the Index by ten key urban design dimensions that matter to quality of life. So if, for example, connectivity and parks are more important to you (or your talent base) than aesthetics or density, you can analyze each block by just those indices. We're also able to create custom indices and calibrate them based on the outcomes and goals that matter most to different cities and firms - because we're good like that!
The benefits of quantifying livability isn't just for giant companies like Amazon. This is essential for every city in order to maintain economic competitiveness, attract talent, and keep citizens happy and healthy. Don't get bogged down with aggregating summary data to get insight into your city's livability. Our software does the heavy lifting for you. Schedule a time to chat with us today!


