
Stop Gambling on Place
Last week, we outlined our wishlist for the top 10 things we want citymakers to do more - and less of - in 2019 and beyond. First on the “do more of” part of the list was “designing for our lives” - or finally acknowledging that urban design is a matter of life and death and that it must be integrated into Vision Zero or vision zero-like strategies immediately. We urged citymakers to adopt a more holistic approach to eliminating collisions, injuries and fatalities at the heels of our - dare we say - groundbreaking findings quantifying the link between the built environment and road safety. We discussed this work - performed for the City of Durham’s Transportation Department as part of the Innovate Durham program last month (copied again below for your convenience) and had promised a follow up post on exactly what goes into transforming a perilous street into a people-first one. So below, we present to you one of the most critical types of before-after “reveals” and explain what urban design changes will help cities “get to zero” for real.
Get to Know Guess Road
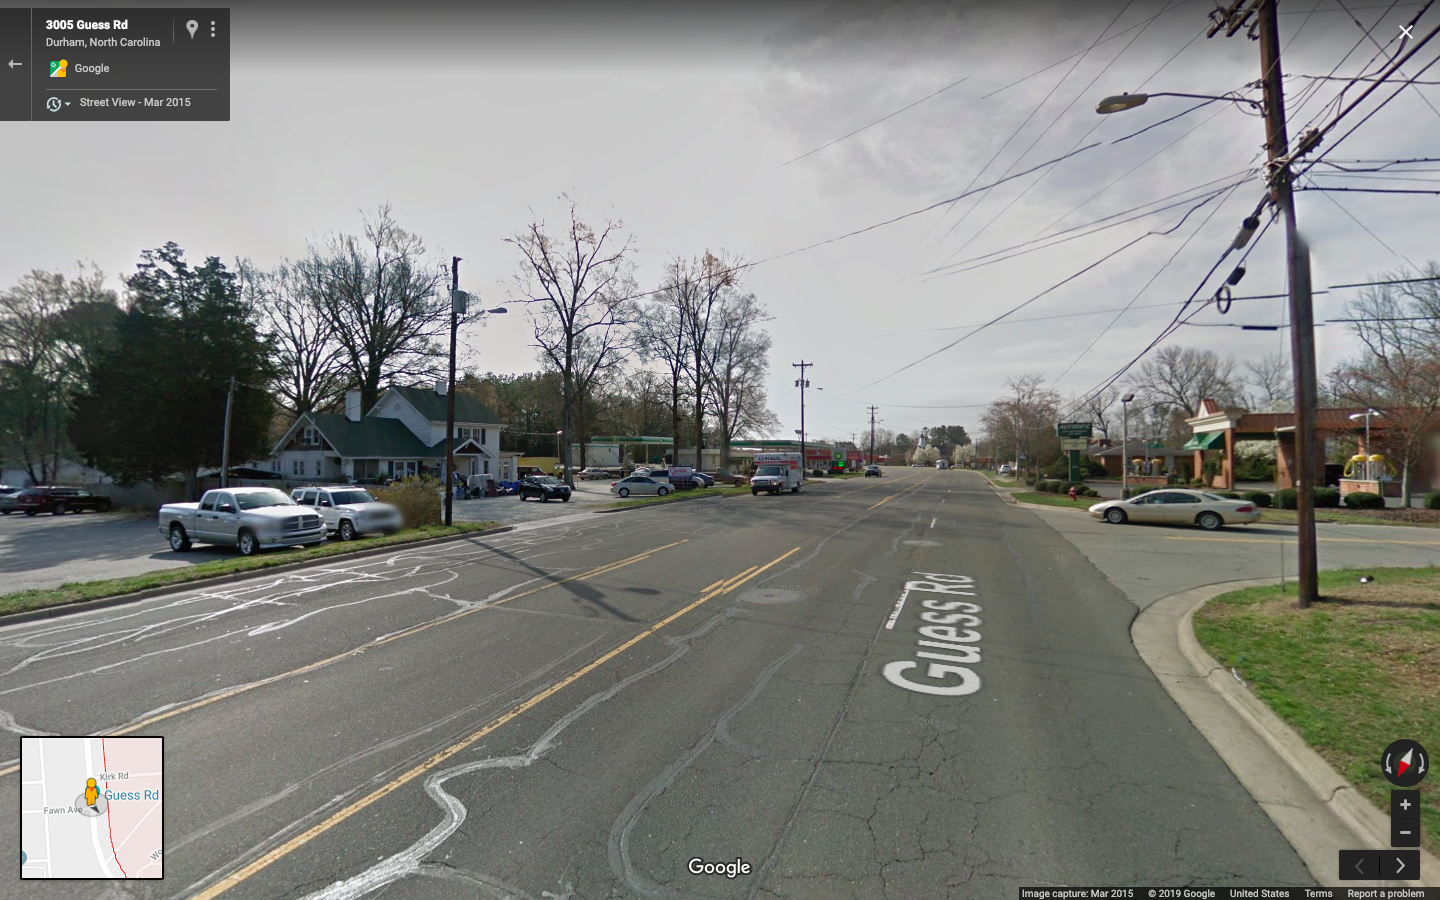
Our first post (the entirety of which you can see again pasted below) was decidedly quite “datageeky.” Done so by design (no pun intended), we wanted to clearly and unequivocally lay out the case for design in the push to make our streets safer. So we hit you over the head with the numbers - most notably, for every one point increase in the State of Place Index, the odds of a collision decrease by 12.3% on average! And while the numbers are impressive (in an incredibly sad way), we understand that (data-backed) pictures can be worth a thousand words. So let’s take a “walk” together down one of the hotspots for which we collected data and put this data into practice - meet Guess Road.
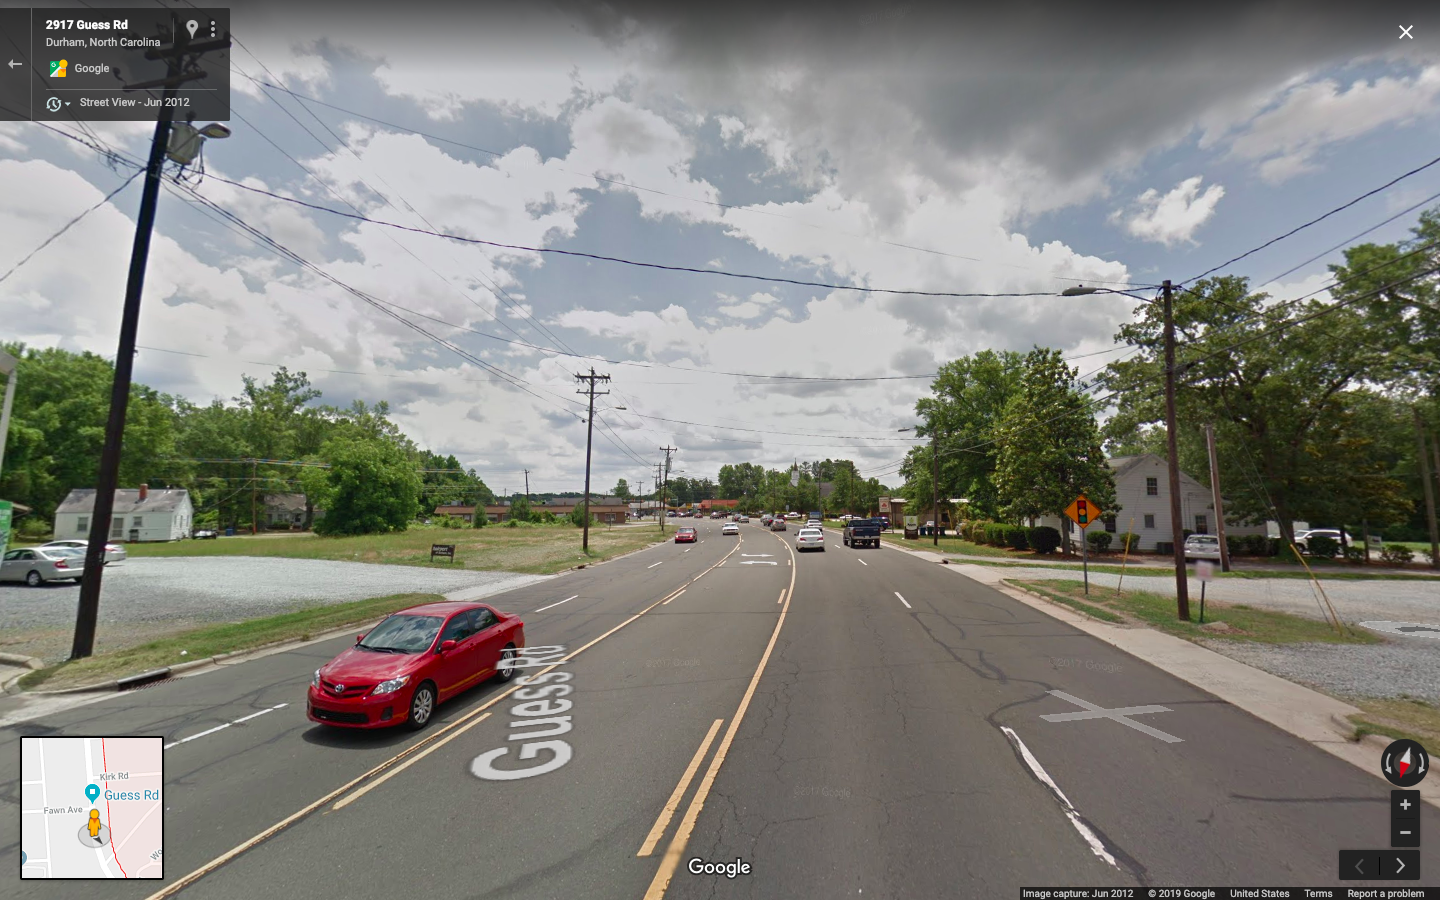
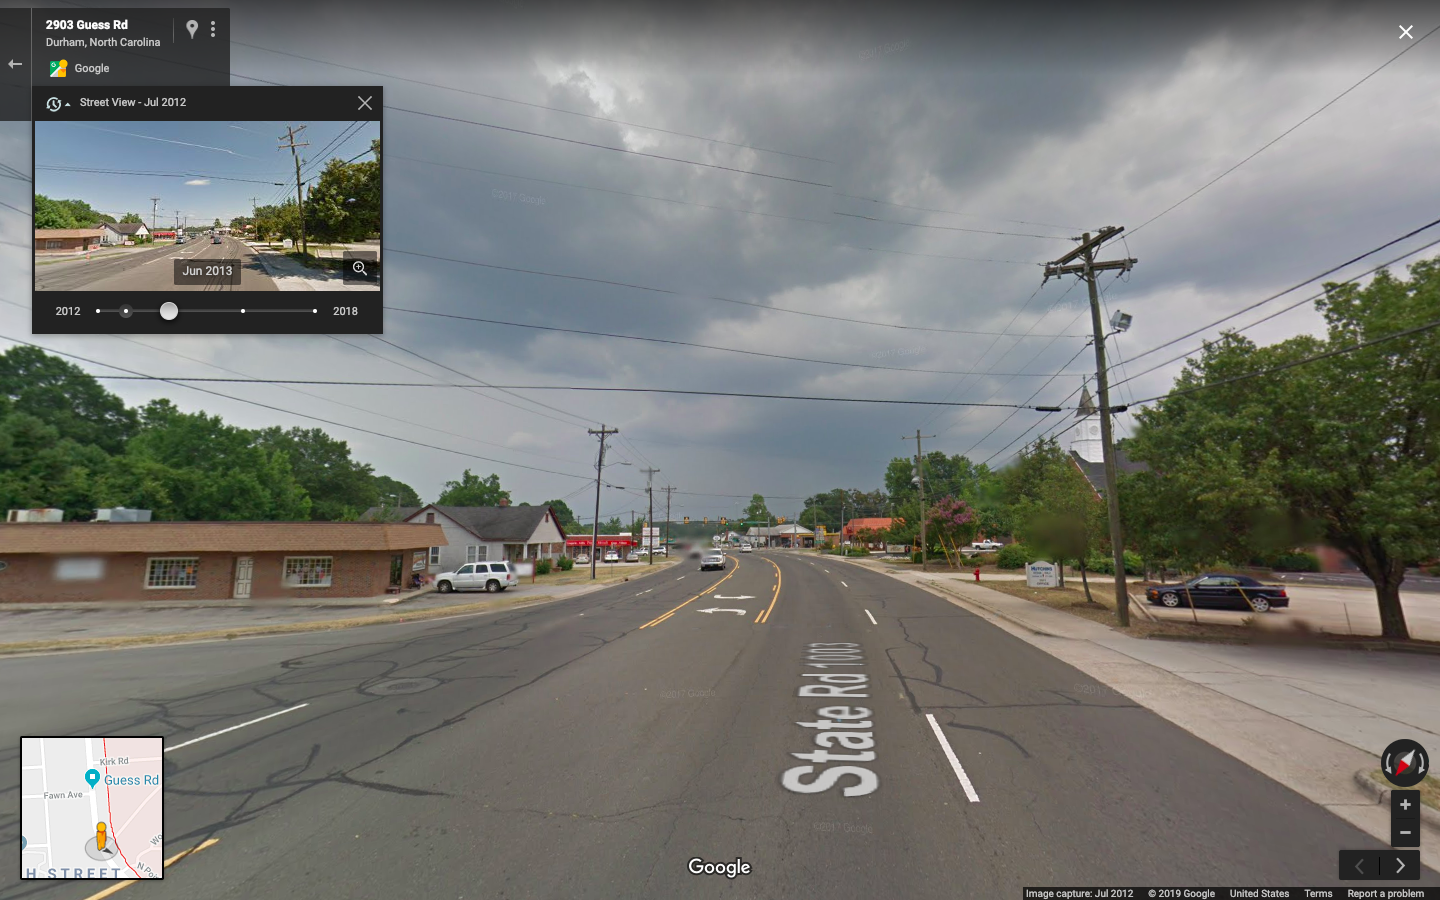
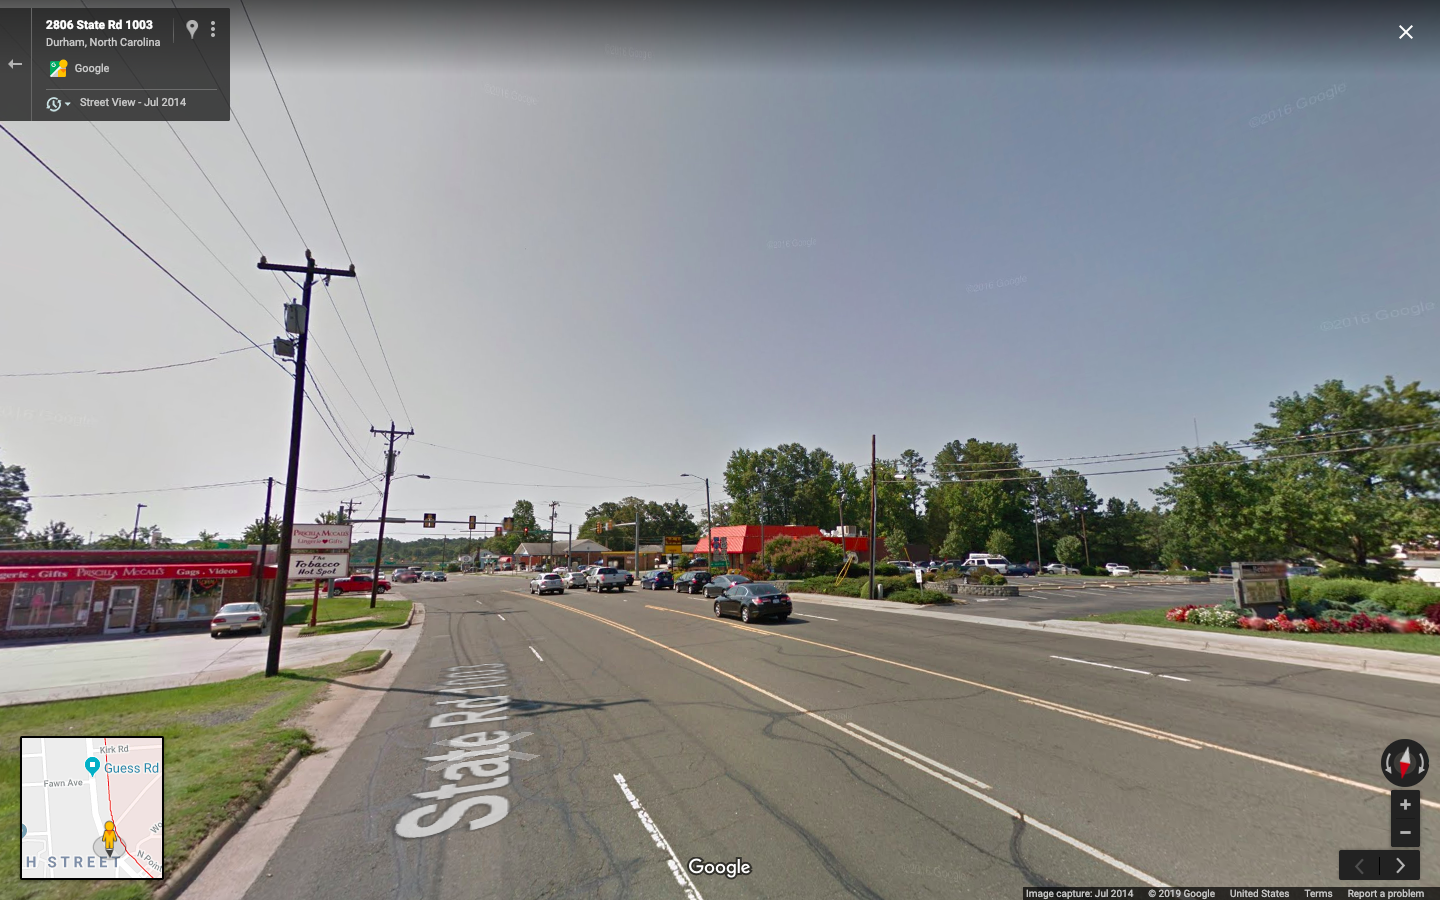
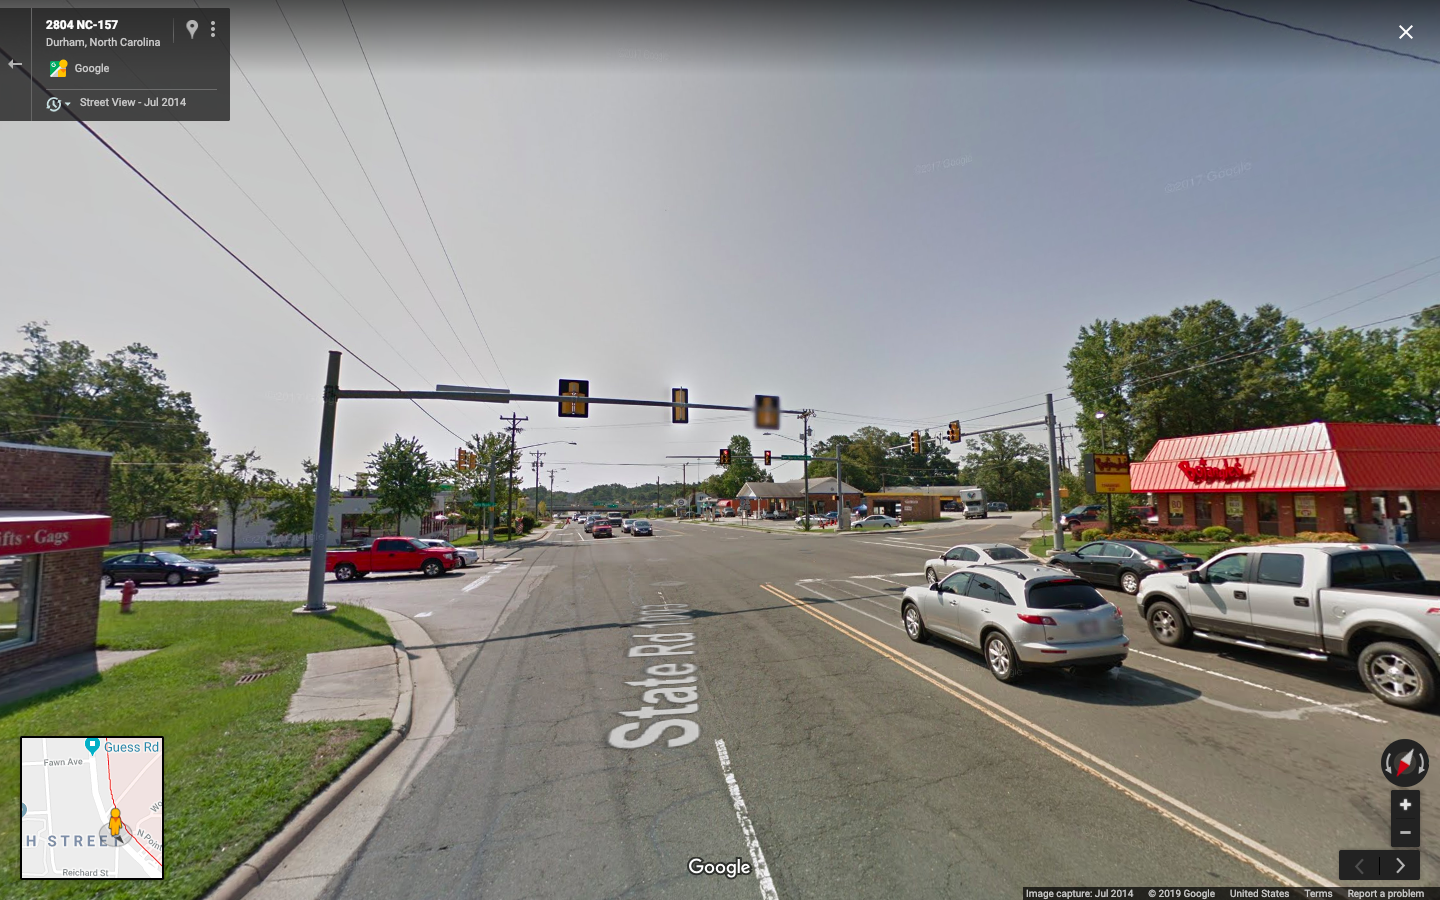
A Devastating Guess
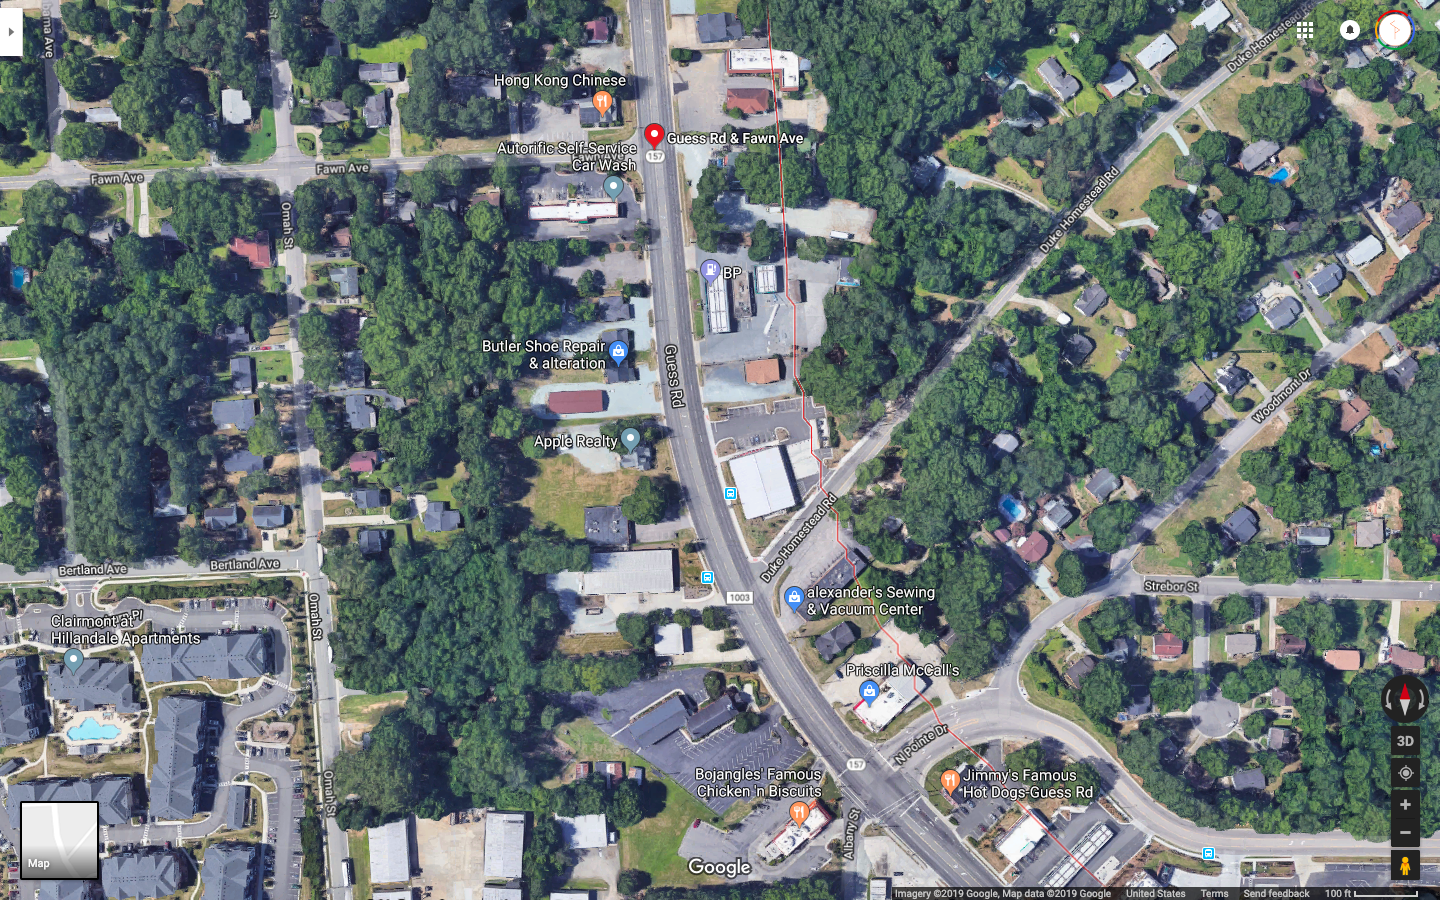
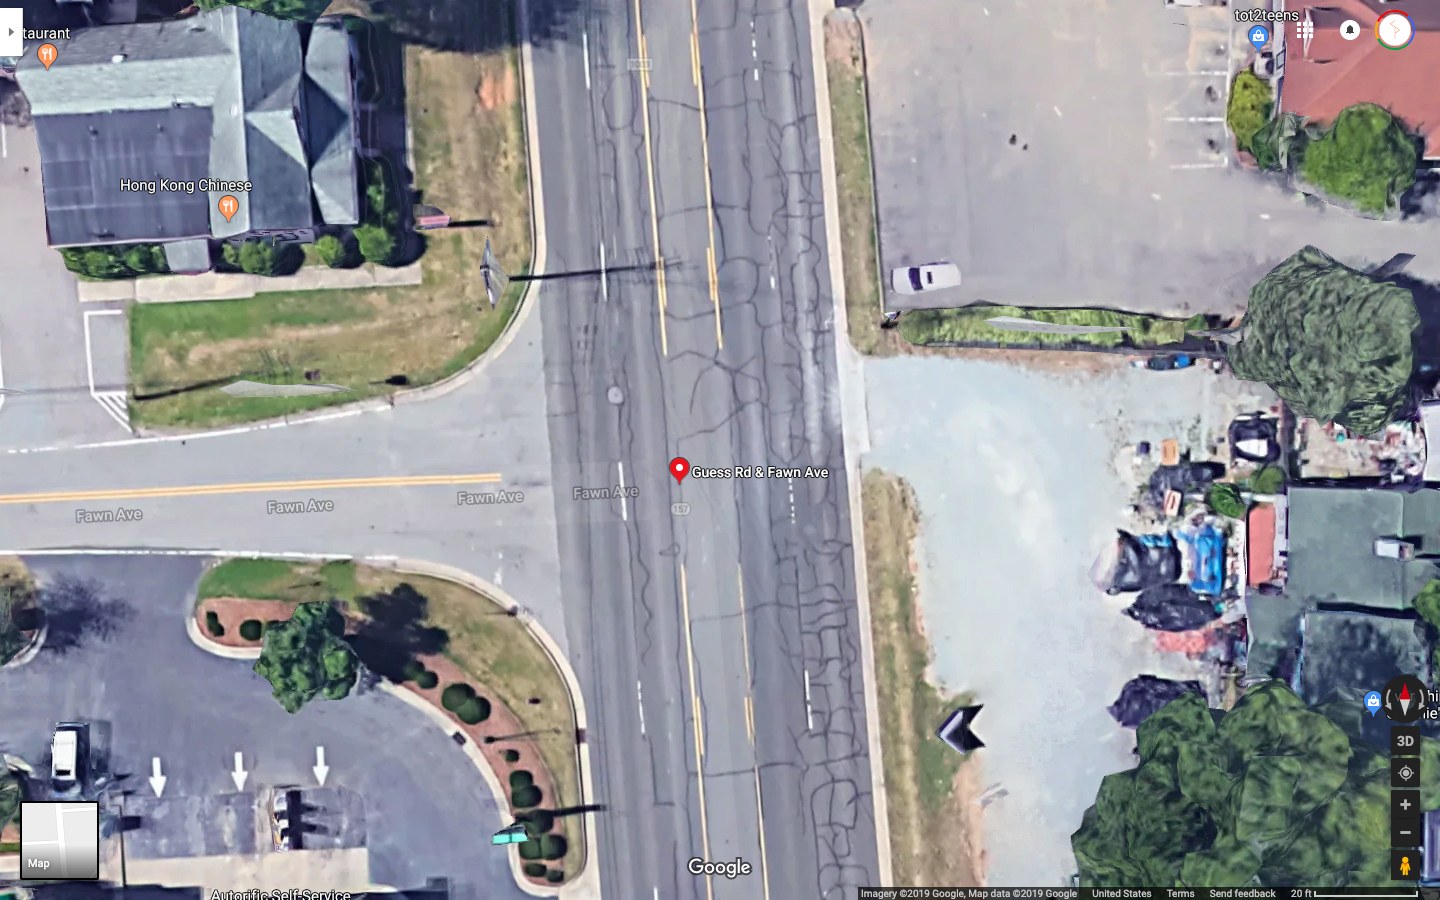
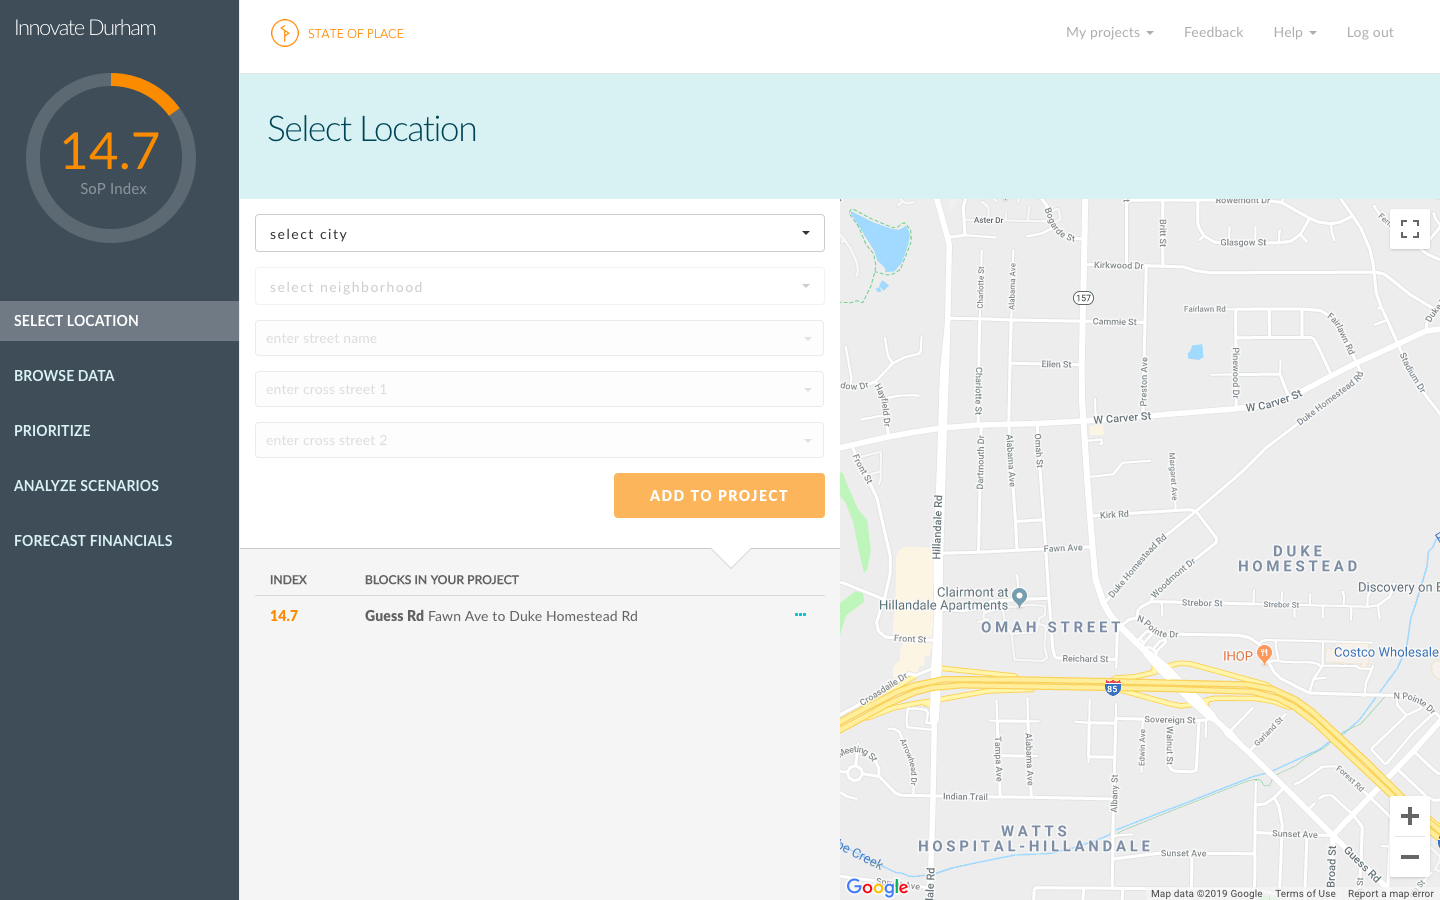
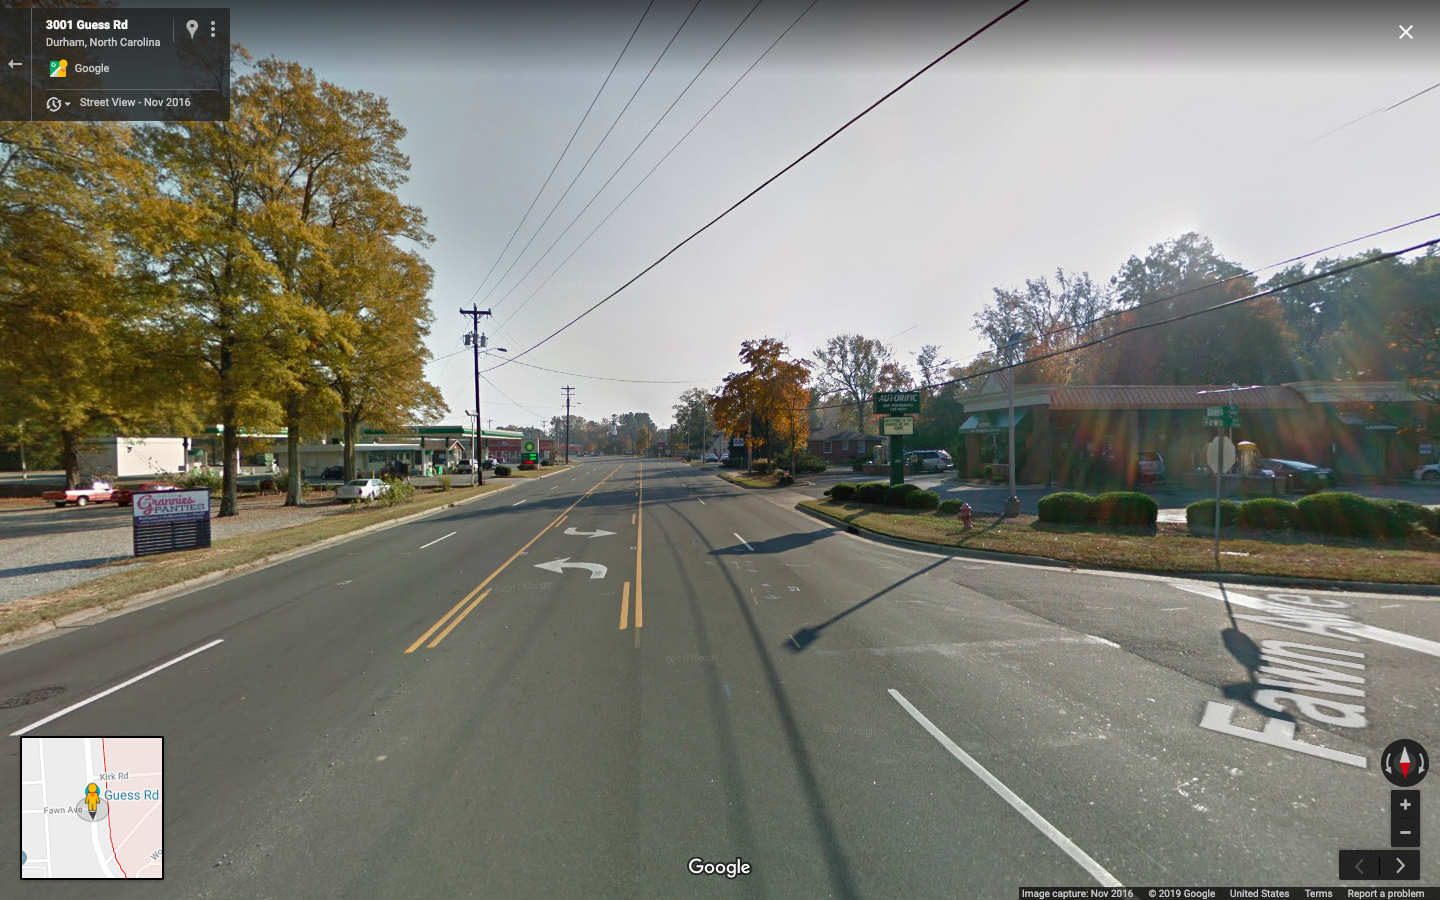
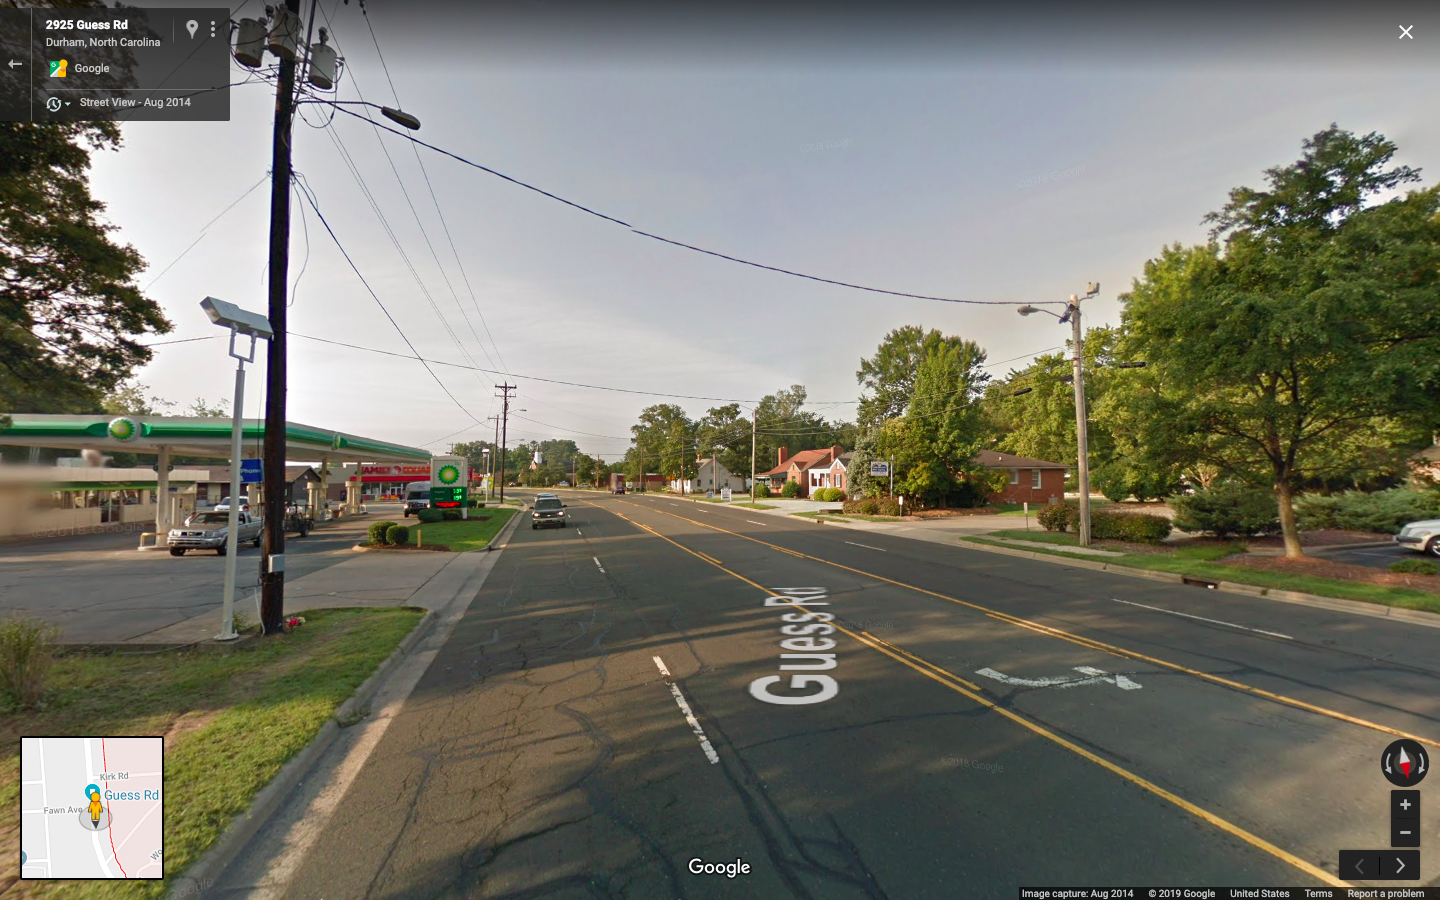
On January 21st, 2013, a pedestrian lost his/her life after being struck by a driver on Guess Road, who was traveling from Fawn Avenue. Guess Road is a 5 lane, technically 35mph street, that is not just demonstrably - but quantifiably - car-dominated and a pedestrian no-(wo)man’s land. It scored a 14.7 on the State of Place Index, placing it at the lowest level of State of Place! It’s also significantly lower than the average State of Place Index (29.4) of the Durham collision hotspots for which we collected data. Based on its State of Place Index, there is nearly over a 97% probability of a collision occurring on this Guess Road! Ok, that’s beyond unacceptable. So now what? While most predictive analytics “end” here, this is just the beginning for State of Place. Let’s look under the hood (um, sole) to better understand why this road is so dangerous, and more importantly, what can be done to make it safer.
No More Guessing
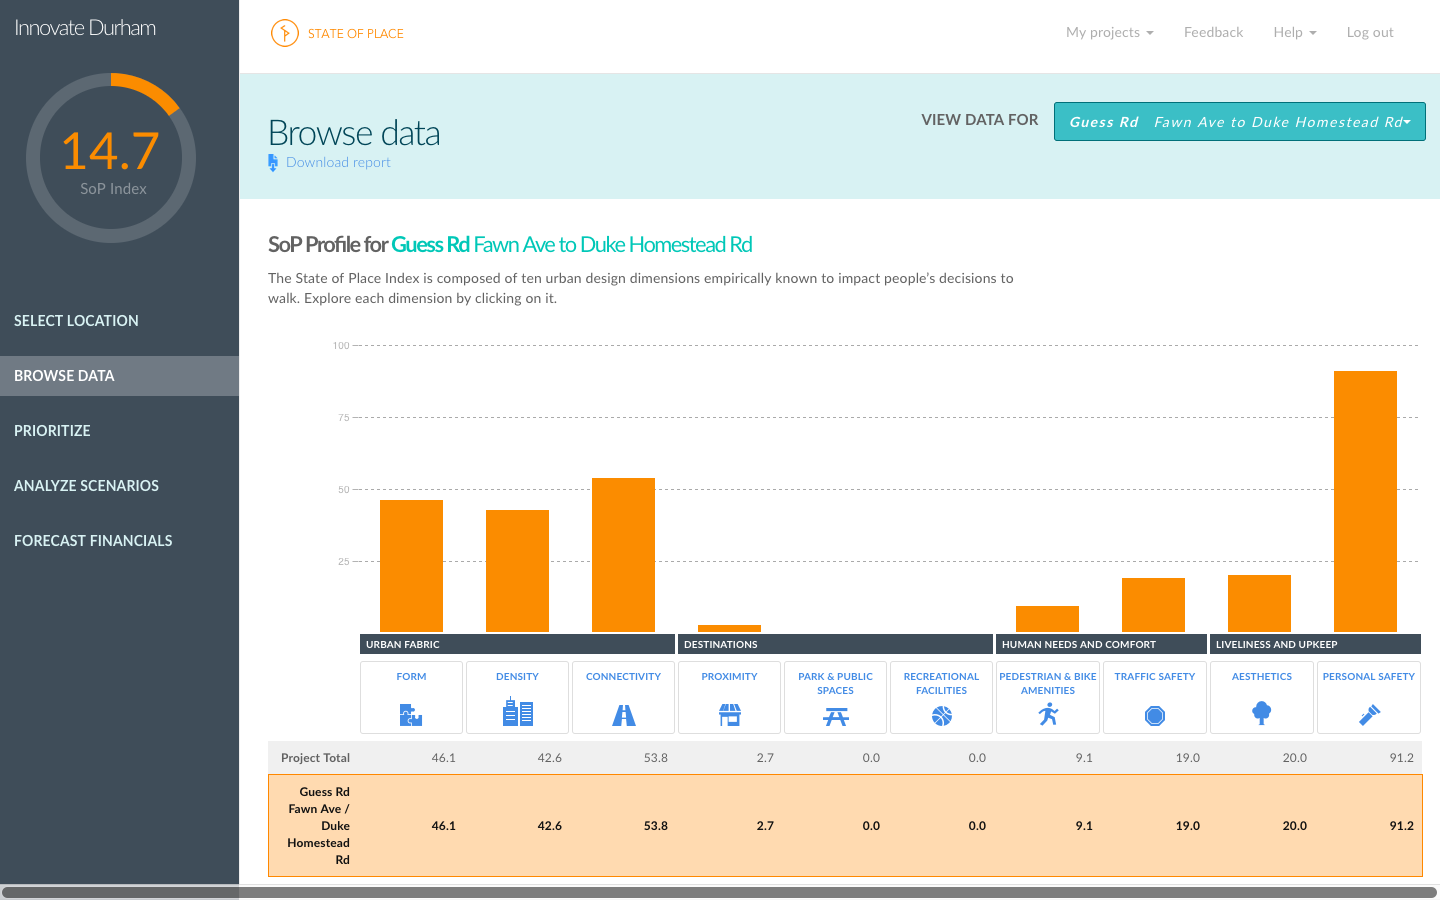


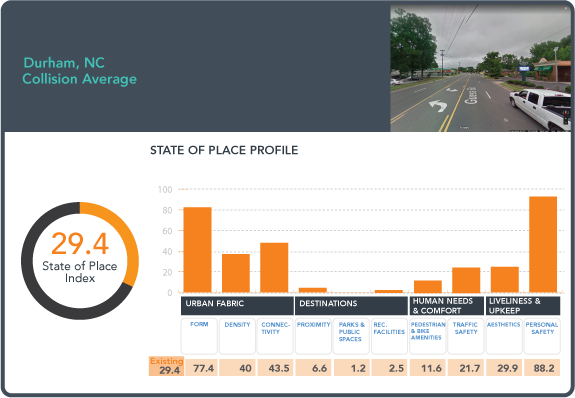
Today, most Vision Zero cities and cities looking to make their streets more pedestrian friendly in general are mostly guessing - or perhaps looking to case studies or “best practices” - as to how to make streets safer (design wise). But as we pointed out last week in our wishlist of things we want citymakers to do more and less of in 2019, context matters and we really should not be adopting cookie cutter approaches to urban design revitalization strategies - especially when the stakes are this high. That’s one of the reasons - and benefits to - that State of Place is neither just a static index that you can’t do anything about nor is it a black box. The State of Place Index can be broken down into scores along ten urban design dimensions known to impact walkability - known as the State of Place “Profile” that highlights an area’s “assets” and “needs.” This helps citymakers actually identify what’s working and what’s not. Let’s go back to Guess Road to see how this applies to a real place in need of TLC. As you can see above in the profile, Guess Road scores quite poorly on proximity (to non-residential destinations), pedestrian and bike amenities, traffic safety, form, and density, and has zero parks and public spaces - all of which we have now tied to the odds of a collision. The State of Place profile starts to pinpoint why Guess street is as dangerous as it is - and what can be done about it.
What Matters to Guess

The State of Place Profile also helps citymakers set priorities as to which “needs” are more critical to address. Clearly, there are many things wrong with Guess Road. But if safety is the biggest concern, even though aesthetics and connectivity are also low, as we explained in Part 1 of this post (repasted below), we now know those things matter less in terms of influencing the odds of a collision. Knowing what matters most to achieving your specific citymaking goals helps planners, transportation engineers, capital improvement officials and others prioritize certain types of changes over others. We currently can prioritize recommendations based on changes that would most impact walkability (pedestrian volumes), office, retail, and residential rents, retail revenues, and residential for-sale values - as you can see above. Now that we have quantified the impact of these then urban design dimensions on safety, we’ll be adding the reduction of collisions as yet another goal citymakers can choose to prioritize and generate custom recommendations accordingly (although we can do that for you citymakers now - just behind the scenes!). Stay tuned for this important new feature!
A Sure “Guess”
Ok so now you know what overall changes to emphasize to help Guess Road “get to zero.” But you can get even more specific. Citymakers can pinpoint the exact built environment changes they need to make to increase proximity, parks and public spaces, pedestrian amenities, traffic safety, form, and density. And you can find out exactly how these changes would impact the State of Place Index and Profile with our fun SimCity-like tool! Take a look at the table below and the video above to see what we changed to bring up Guess Road’s State of Place Index from 14.7 to 60.9!
A Safe(r) Guess
So now that you know how much better Guess Road’s quality of place and walkability will be - and what specific changes you need to make to get there - you can actually translate how this 46.2 increase in the State of Place Index - and Profile - can save lives. Specifically, because we have now quantified the link between urban design and safety, we can predict that the improvements to Guess Road will help reduce the odds of a collision from 88.7% to .033% - showing once and for all that urban design is indeed a matter of life and death…So, similar to how we now can predict how increases to the State of Place Index impact premiums related to office, retail, and residential rents, retail revenues, and residential for-sale values, along with the amount of value generated due to these premiums and the return on investment tied to making the built environment better (see above), we can help citymakers translate how their Vision Zero and safety efforts can save actual lives. Stay tuned for this new safety forecast feature as well.
It was an absolute honor working with the folks at Innovate Durham and the Durham Transportation Department. We hope that this work informs their important mission and Vision Zero strategy action plan moving forward - and are also hoping that State of Place can play a role in Durham’s many exciting new initiatives, including Move Durham - a nine-month multimodal transportation planning process, specific projects like the proposed LaSalle Street sidewalk improvement plan, and more! :) And of course, if you want to walk with us on the path to Zero or learn more about the work we did for Durham as part of the Innovate Durham competition, feel free to request a time to chat and/or take our software for a test walk!
And here is Part 1 of our Innovate Durham blog posted, pasted again here for your convenience…
Getting to Zero - State of Place Style!

Wow, what an interesting 6+ months it’s been! In May, we launched our Design for our Lives blog series, exploring the role that urban design was playing - or not - in Vision Zero strategies aiming to eliminate road collisions, injuries, and fatalities. After analyzing how 35 U.S. cities were tackling this honorable aim - and noting that design was sadly, decidedly, not a significant part of most cities action plans, we got the opportunity to work with the City of Durham, as part of their Innovate Durham program, to tie the built environment (as measured by State of Place) to safety, to help cities - like Durham - implement a more data-driven, and more holistic approach to “Get to Zero.” Yesterday, on Demo Day, 12 weeks after the inception of the program, Devin Nieusma, our Customer Development Intern, presented our work to various municipal departments from the City of Durham. TLDR; Design matters - quite simply, intersections in which people have lost their lives are just not designed to keep pedestrians, cyclists, and even motorists, safe - period. But we encourage you to dig deeper into our results, which shows the odds and probabilities of collisions based on the quality of urban design, as measured by State of Place.
all about that data
State of Place trained four community members to collect over 290 urban design features for a sample of blocks across the City of Durham's existing hotspots (areas where there have historically been a high concentration of traffic collisions) to get an initial baseline of existing walkability (State of Place Index) as well as the current built environment assets and needs (State of Place Profile).

Specifically, we extracted the Walk Scores for each the City of Durham’s 376 hotspots, and grouped them into five levels of “performance” along this proxy for walkability, based on the hotspots’ average and standard deviation. We then sampled a random - proportionate - number of hotspots from each level, totalling to 60 total hotspots. We then mapped out all blocks (the area between two intersections) that were adjacent to each of the hotposts. Together, this amounted to 372 total blocks for which we - including Durham community members - collected State of Place data (see map below). A special shout out to our super-human data collector, Dan, for collecting the most data out of our community volunteers - he collected data for 77 blocks!

A Poor Place Diagnosis…BUT
Overall, the City of Durham’s hotspots need a lot of urban design TLC…with an average State of Place Index of 29.4, they are (statistically) below that of the average State of Place Index (based on our database of nearly 8000 blocks) of 35.6.
Average State of Place Index & Profile of sample of Durham, NC’s collision sites from 2012-2016
Average State of Place Index & Profile

Average State of Place Index & Profile of sample of Durham, NC’s collision sites + adjacent blocks
Taking into account blocks adjacent to the hotspots, the State of Place Index of 28.2 is even lower than that of the average of the blocks in which the collisions occurred. This tells cities they need not only address urban design issues of collision sites, but must also improve the built environment of surrounding blocks. In fact, the very definition of the term hotspot should be expanded to include adjacent blocks.
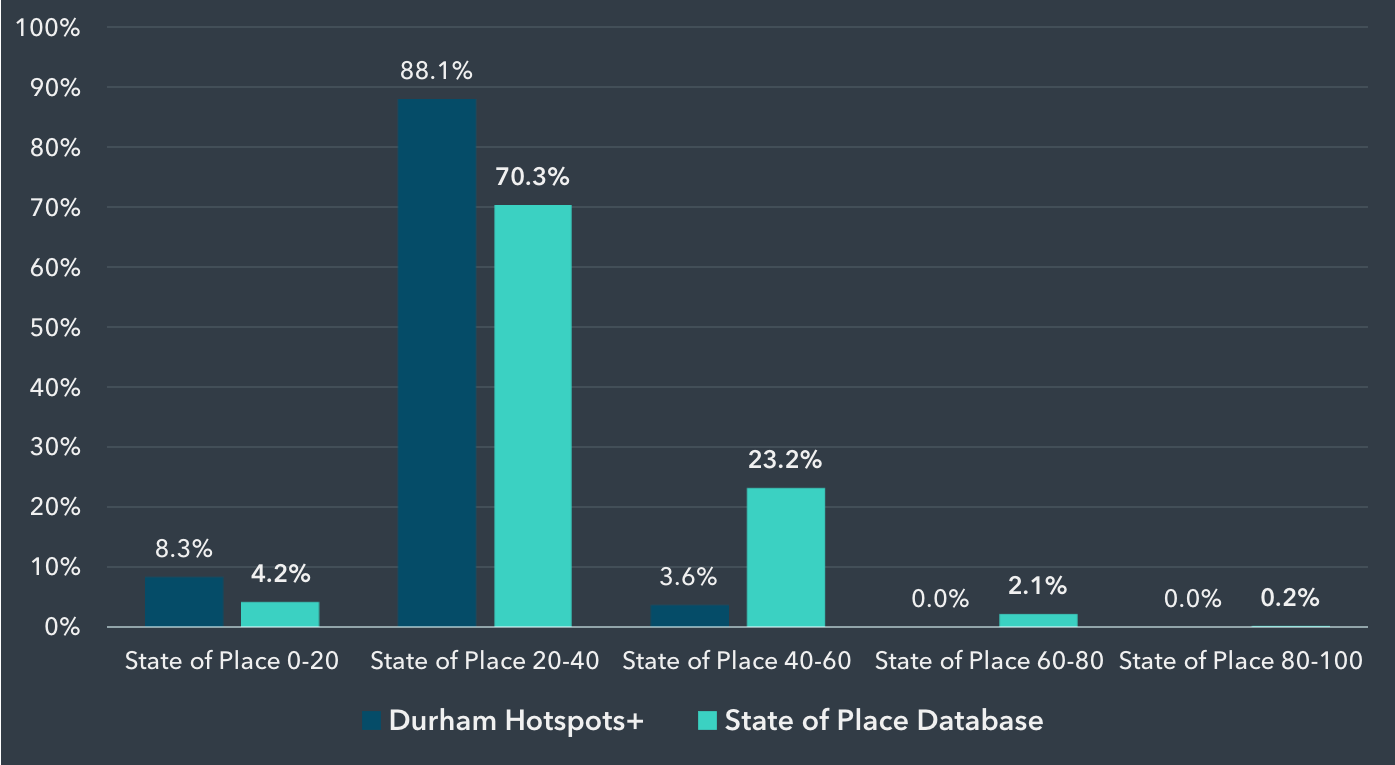
Now, you might be thinking, geez, the average State of Place Index of 35.6 is pretty low to begin with. We tend to agree - but this just highlights the fact that U.S. cities (of which our database is mostly comprised) need a lot of TLC, period. But we should also point out that unlike other scoring systems, State of Place is not based on a “ranking” but rather on “performance” - so it’s actually pretty hard to get a score of 100, or even 90. In fact, below, you can see how our database “stacks up” across five levels of the State of Place Index. As you can see, just over 2% of the entire database scores over 60! That said, when you compare the overall State of Place database to that of Durham’s hotspots, you can see that the City’s unsafe blocks are decidedly over-represented at the lower levels. That is, nearly 90% of Durham’s hotspots (we’ll use this term to refer to the collision sites and their adjacent blocks moving forward) score between a 20 and 40 on the State of Place Index as compared to just over 70% in the database; nearly twice as many score in the lowest level of State of Place; only 3.6% score between a 40-60; and none of them score over 60, period. There is no doubt that Durham’s hotspots are not just poorly designed, they are some of the most poorly designed streets across our 248 neighborhoods for which State of Place currently has data (which in and of itself is a microcosm of the typical walkability across most U.S metro regions).
Bottom line, the design of these hotspots is decidedly not pedestrian or bike friendly. But now what? How much of the reason that these collisions occurred is due to urban design in the first place? Can it be a coincidence? Could it be that most of Durham blocks are similarly designed and these are just where these tragic incidents happen to occur? Well, that is exactly what we wanted to know - and tested - using a technique called logistic regression that will help us understand how urban design impacts the odds and probability of a collision occurring.
A promising place Prognosis
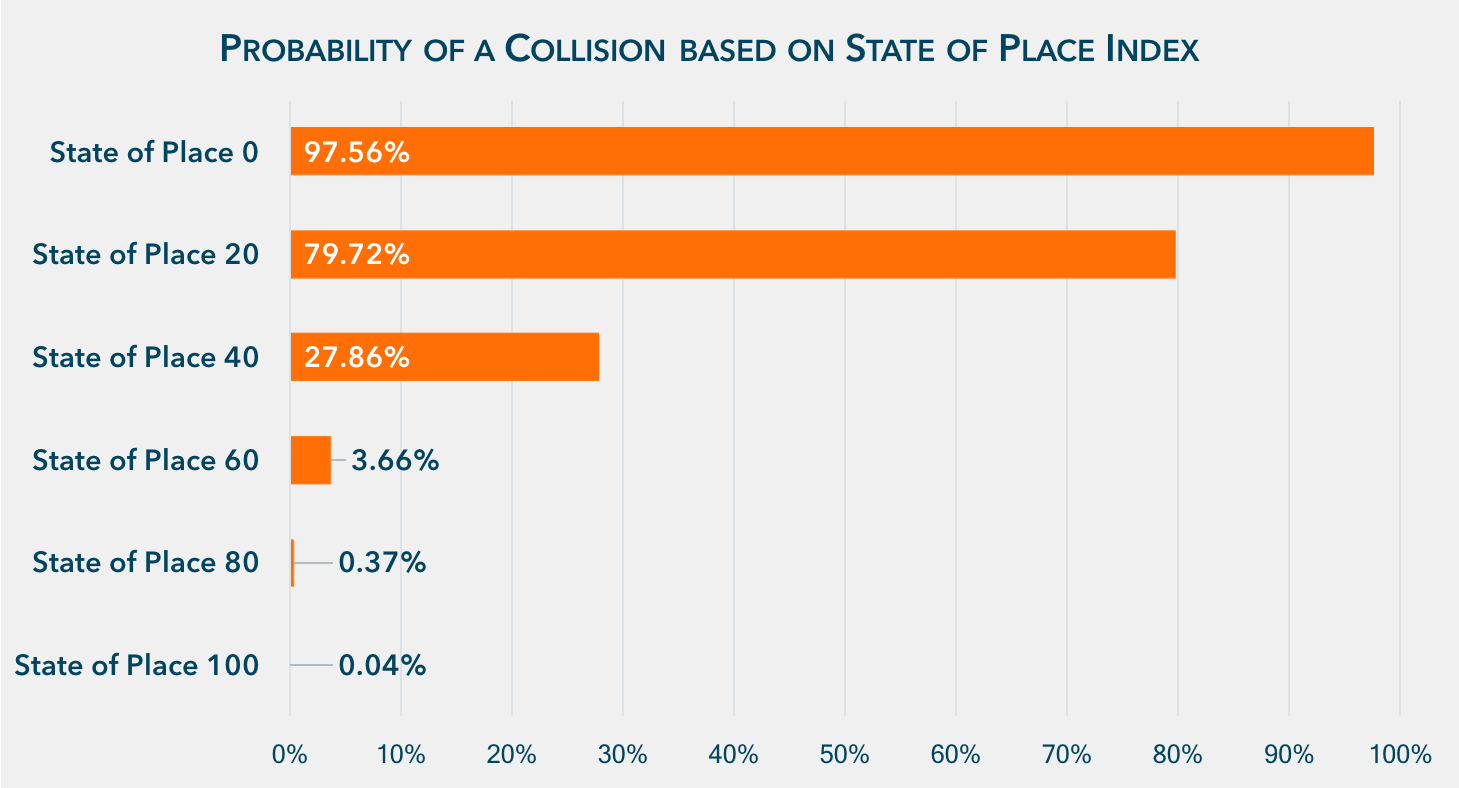
After comparing the State of Place Index of the hotspots (collisions plus adjacent blocks) to a random sample of blocks from our database, we found that for every one point increase in the State of Place Index, the odds of a collision decrease by 12.3% on average. And as you can see below, the impact of design on the probability of a collision is much more “pronounced” the lower your baseline score is. That means that even a relatively small improvement on the State of Place Index - which can be achieved by doing fixes as simple as adding sidewalks, curb cuts, and crosswalk markings - can have a HUGE impact on saving lives.

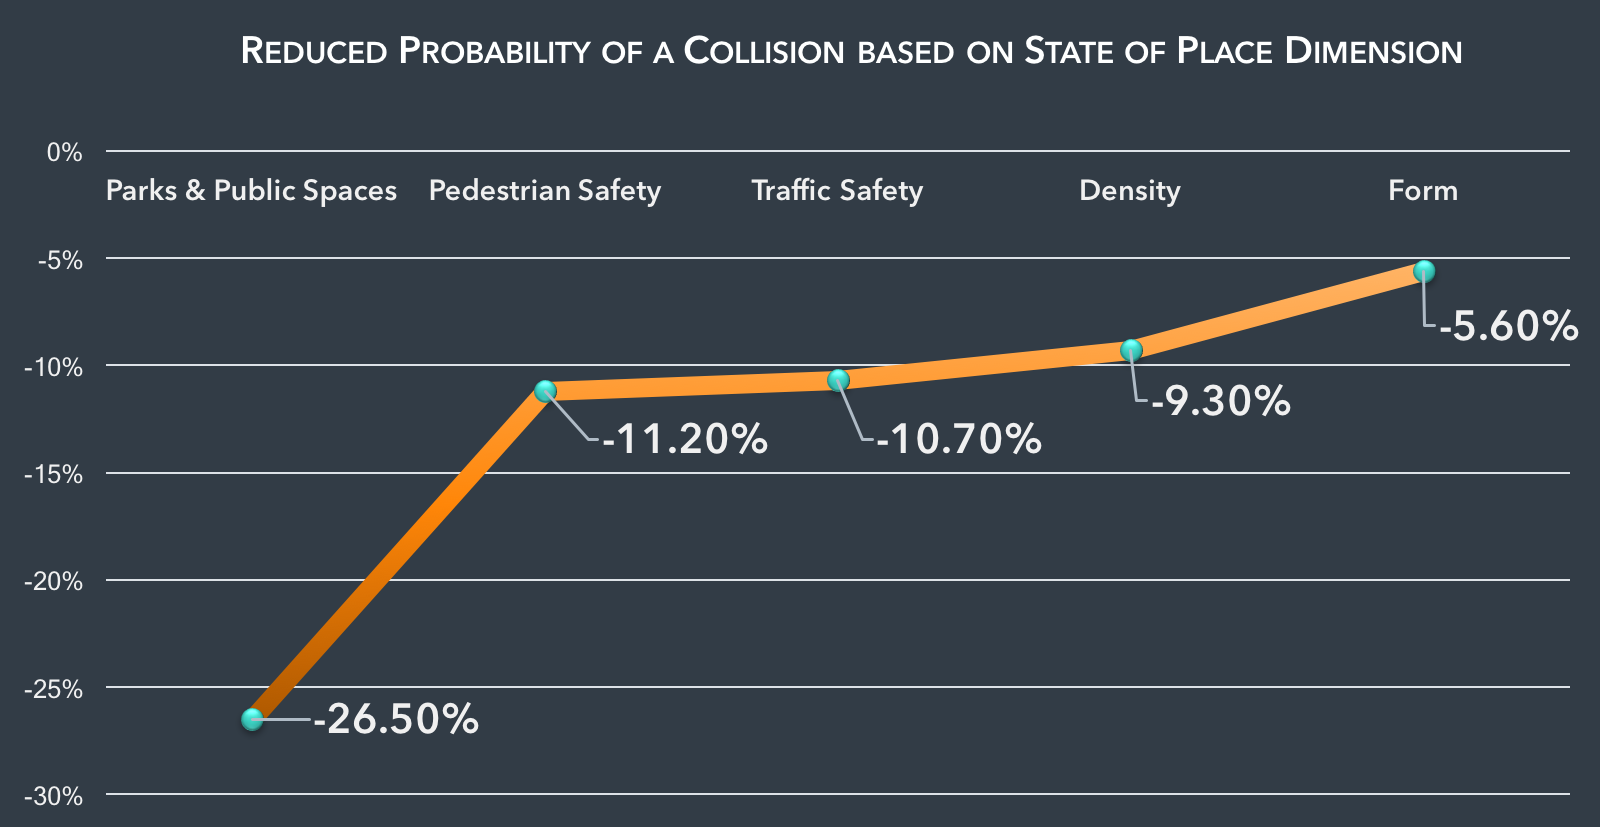
We went deeper into our analysis to understand how the ten urban design dimensions that make up the State of Place Index “factor” into street safety. Turns out the that presence, quality, and access to parks and public spaces has a very high impact on the odds of a collision - in a good way, as do pedestrian safety, traffic safety, density, and form. Specifically, a one point increase in these dimensions reduced the odds of a collision as per the chart below:
On the flip side, a one point decrease in perceived crime safety and proximity to non-residential locations increased the odds of a collision by 12.8% and 3.7%, respectively. The tie-in to perceived safety has a very important implication from an accessibility perspective, as it indicates that areas in which people feel less safe - personally - are also areas in which the odds of a collision are higher, once again signaling the inherently inequitable access to safer places overall.
Design for - all - our lives, NOW!!
Bottom line, design matters for all of us - and in particular for those most vulnerable among us. And most importantly, we have finally, without question, quantified that design is literally a matter of life and death…Twenty people lost their lives in the hotspots for which we collected data - 16 of these were pedestrians and bicyclists. Cities must absolutely stop playing with people’s actual lives - they must stop just “intuiting” what design changes matter or simply copying and pasting what other communities have or are doing. We now have data that 1) shows which hotspots need the most attention; 2) shows what’s working and what’s mostly not; 3) identifies which specific changes to make that will make the most impact - or reduce the probability of someone dying at the hands of a city; and even 4) have data that shows the dollars and cents behind it (if you still need that to justify the changes). Quite simply, there is no excuse NOT to use this data, like yesterday. Cities can access this data via an easy (and may we add - fun) to use software, to create effective, cost-efficient projects, quickly and affordably. No brainer - but just in case you have an inkling of doubt, the week after next, we’ll show you exactly how we could increase the State of Place Index of one of Durham’s collision sites from a 28.2 to a 74, or more significantly, reduced the probability of future collisions on that intersection from 60.8% to .74%. In the meantime, we invite you to join us - let’s all work together to DESIGN FOR -ALL- OUR LIVES…
Also, HUGE shout out to Dr. Elizabeth Shulman, who helped me brush off my logistic regression skills and interpret the results of these analyses in the most “lay-friendly,” translate-straight-into-design-and-policy-ready language possible! Gotta love #anteater life (inside joke - go UCIrvine!).


