
State of Place Data
Quantifying What People Love about Places
The Data: What & How
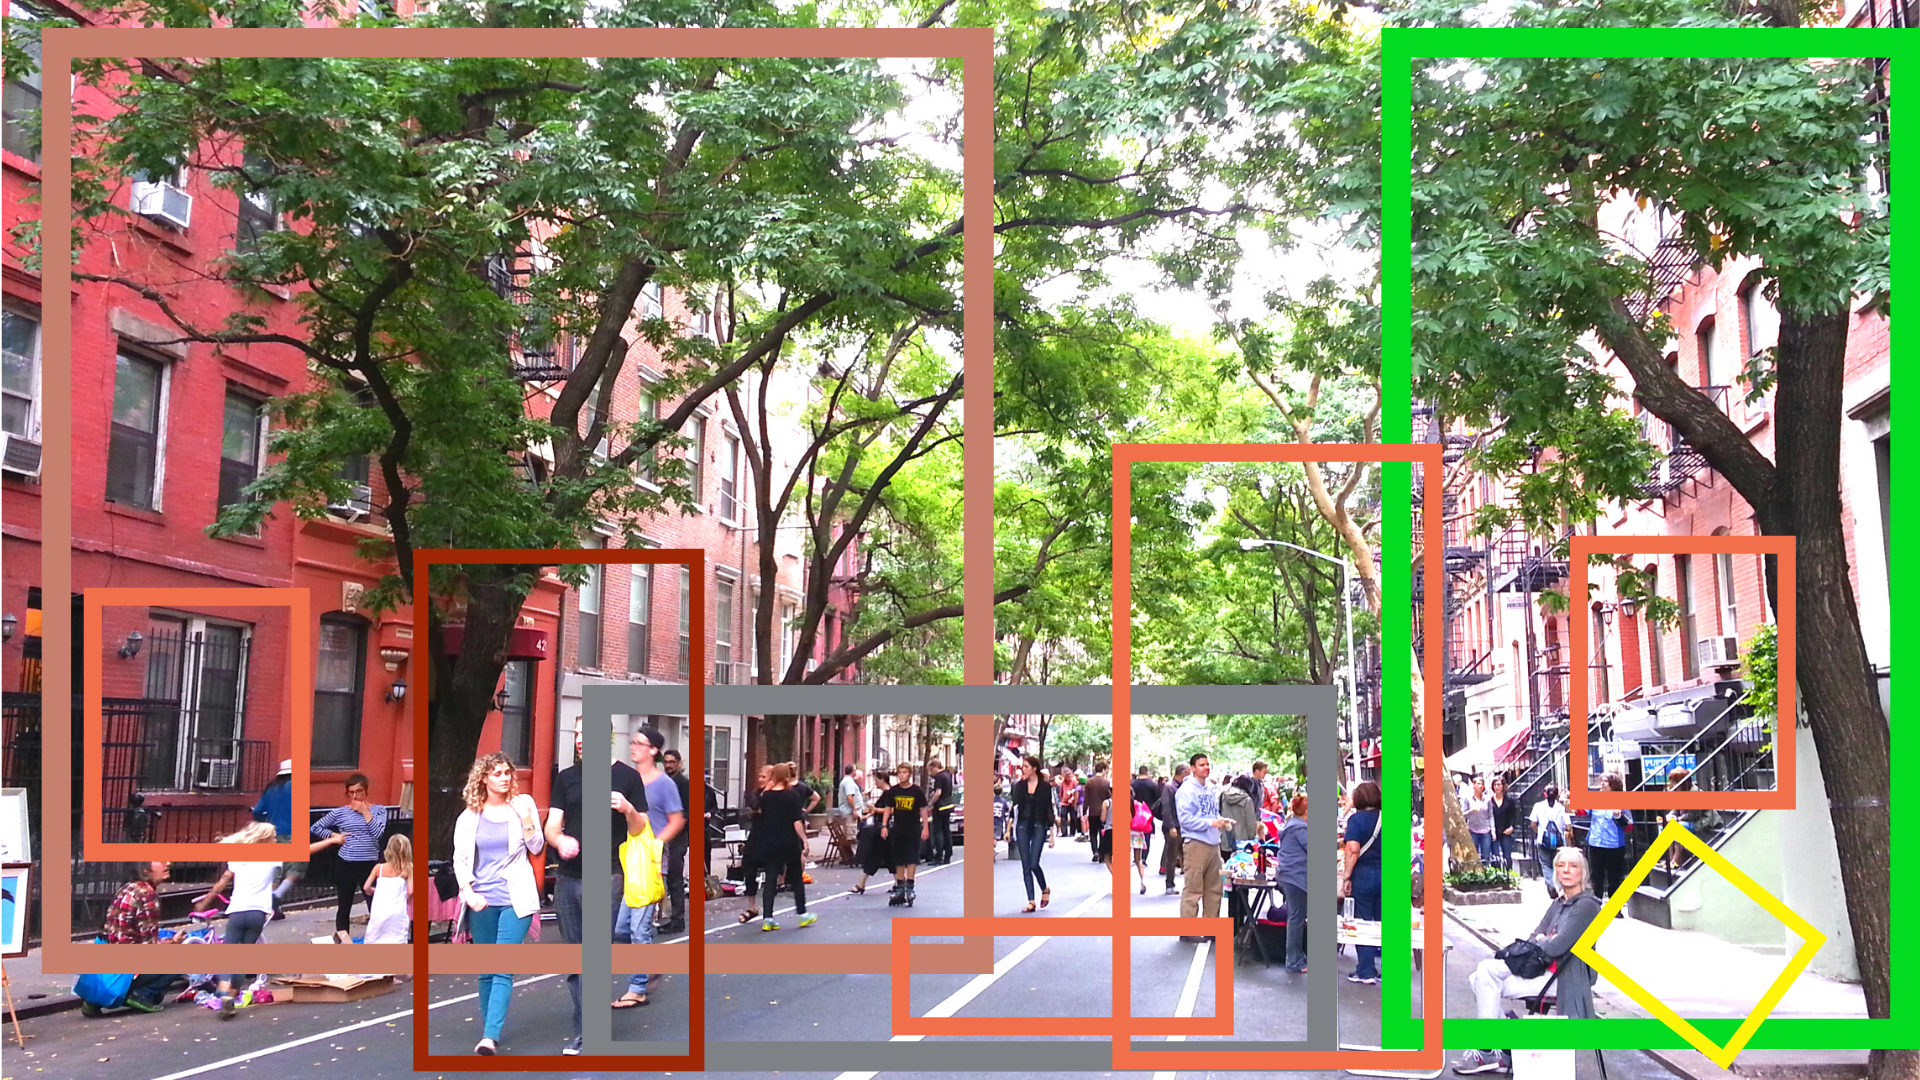
We use AI-based, machine learning models to automatically collect data on over 125 urban design features – like street trees, sidewalks, benches, curb cuts, bike lanes, parking, public spaces, land uses, and more!


We focus on these "micro-scale" built environment features because we know - based on decades of evidence - that they impact how we feel about our streets, neighborhoods, towns, and cities. In turn, these urban design characteristics influence our choices, from where we live, work, visit, or play; our behaviors, like whether we walk, bike, or drive; our perceptions of vitality, safety, or belongingness. And finally, these perceptions, feelings, choices, and behaviors influence the social, economic, health, and environmental value of our communities - and people’s quality of life.
Why is this data different?
We often get asked how we differ from other known walkability measures, like Walk Score. The fact that we measure nitty-gritty features about the public realm is one of the key differences between a robust measure of walkability and place quality, like the State of Place Index, and a "proxy" for walkability that's based primarily on density (and to a certain extent, quality) of destinations, like Walk Score. Consider that walkability is more than just access to and quality of destinations - it's about the safety, comfort, and pleasurability of the walk as well. The micro-scale nature of the data that we collect allows us to offer a more comprehensive measure of walkability that is more suitable for diagnostic purposes, which is partly what helps position State of Place as an effective data-driven, evidence-based planning, policy, and investment tool.
How Does this Data Help Me Create Livable, Equitable, & Sustainable Places?

Assess
Spatial equity & livability based on 125+ street-level urban design features

Optimize
Budgets & prioritize community-scale interventions that maximize quality of life

Imagine
And co-create your community’s future using our SimCity scenario tool

Justify
Quantify the social, fiscal, environmental & health benefits of proposed scenarios
The Data: Its Origins
State of Place's foundation was set by an objective audit tool known as the Irvine Minnesota Inventory (IMI). The IMI was developed between 2003-2005 by a team of researchers at the University of California, Irvine: Kris Day, Marlon Boarnet, and yes, Mariela Alfonzo (our very own Founder and CEO) and then tested for reliability with help from researchers at the University of Minnesota (hence the name). Funded by the Robert Wood Johnson Foundation, through a decade-long partnership with Active Living Research, the goal of the IMI was to create an objective measure of the built environment features that (were then hypothesized to) impact physical activity, including both purposeful walking (walking to destinations) and recreational walking (walking for leisure or exercise).
At the time, empirical connections between the built environment and health (via the mechanism of physical activity and walking) were scant, partly because researchers lacked tools to quantify the urban design features that might impact this relationship. The IMI aimed to fill this gap. Accordingly, its developers aimed to include an extensively comprehensive list of built environment characteristics that might impact people's decisions to walk. After scouring nearly 60 different neighborhoods in California, ranging from 1) low, middle, high-income; 2) urban, suburban, exurban and rural; 3) and residential, mixed-use, and commercial, an initial list of over 240 features was developed; it was streamlined to 162 after reliability testing was conducted in Irvine and Minneapolis.
The tool was used widely in academia and even in practice for several years. Then, in 2011, Alfonzo and Day began to set their (research) sights on China, having grown incredibly interested by its rapid pace of (mostly auto-oriented) development coupled with its rising obesity rates. Seeking to empirically establish the links between the built environment and health in China that had been well-acknowledged in the Western context by over a decade's' worth of research findings, they knew the first step in achieving that aim was to update and adapt the IMI. After canvassing over 15 neighborhoods throughout Beijing and Shanghai and carefully noting all of the needed modifications illuminated by years of applying the tool, the IMI was revised, adding a number of items, most notably features that would impede pedestrian movement, characteristics of the streetscape, and a number of more detailed land use types. Turns out a lot of the new items inspired by direct observation in the streets of China would impact walkability no matter what. So, and then there were...290+!
From 2011 through 2020, this micro-scaled built environment data had been collected manually. This tedious, time-consuming process (on average, it would take 20-25 minutes/block to collect data) limited the geographical scope of analysis that we could feasibly offer our customers. This is why we worked tirelessly for several years to automate the process using machine learning and other data science techniques. We’re now able to collect data in a matter of seconds, allowing us to cover tens of thousands of blocks in a 2-4 weeks time.