
Your Absolutely Essential Everything You Need to Know About Vision Zero Guide!
After a several week hiatus from our Design For Our Lives, Vision Zero Blog Series, we are back - with loads of data (hence the longer than anticipated intermission). This week, we broke down all the essential details you ever wanted to know about the 35 U.S. cities who have pledged to eliminate traffic fatalities and brought them to you in a series of handy visualizations, interactive maps, and even word clouds. If you're a Vision Zero city, check out how you compare to your fellow peers and if you're NOT (get to it and) see how other cities are paving a safer path for pedestrians and bicyclists. And if you're keen on using data to get to Zero, we'd love to help you use data to identify and prioritize problem areas and recommend changes with the biggest impact.
Methodology
We datageeks at State of Place reviewed ALL 35 Vision Zero websites, and conducted a "content analysis" of their action plans, executive summaries, data, maps, and resources, scouring them for information on their timelines, focus areas, primary aims, strategic actions, budgets, funding mechanisms and organizational structure. We also compiled data on 2016 pedestrian and bicyclist fatalities counts, percentages, and rates for each city (some do *NOT* make this easy to find - which is totally not cool, by the way). We have organized our findings into 8 key areas:
The Basics - high-level strategies and tools
The Timeline - from adoption to ultimate goal
The Low Down - Vision Zero Vision in 10 words or less
The Drill Down - the focus areas and main actions
The Common Themes - most popular themes
The Long Road Ahead - pedestrian and bicyclist fatalities by city
The Money - budgets, appropriations, and funding sources
The Team - how well do Vision Zero folks play together
Turns out the thing that most Vision Zero strategies have in common are that they are quite different. Now, that may not necessarily be a bad thing, as these cities face their own set of unique challenges and these varying approaches might be warranted, especially as no one really has "best practices" yet. So, as we continue to dig into our series, we'll do a critical analysis of the language the "movement" uses to describe pedestrians and collisions (and how that might impact outcomes), follow it up with a deep dive into select cities and bring you the story of their vision in their words, and we'll end with an awesome podcast, interviewing one city we feel is focusing on a more holistic approach (shh...we have some early contenders for which city we'll highlight...will it be your city? Check out our Vision Zero Essentials below and scroll down to contact us! We can be persuaded...with data of course! ;)
Vision Zero Basics
For the basics, we categorized each city's Vision Zero strategy on the basis of whether it's a focus city or emerging, it has an action plan, gathers data on crash hotspots, has a complete streets policy (whether or not its integrated into the Vision Zero strategy), and has an urban design focus. Oh, and we did it as an interactive map because cities and we are State of Place, after all!
View Vision Zero Interactive Map in a full screen map
Vision Zero Timelines
Last night, one of my interns, actually the one who did all of the research for this blog (because you know that's how it goes! ;) told me (after reading a transcript of a chat with me and a prospective customer while he was visiting the State of Place website while watching the World Cup - and while I was partaking in some rum at 230am on a Saturday night) that I was seriously "goals." Let's ignore the potential pun here and note that it's seriously these cities that have like, goals! And it's amazing. You go City of Fremont! Five years to Vision Zero. As far as we're concerned, the sooner the better (plus we know data can help you get there faster, so call us - or chat with me in the middle of the night on our website - apparently I'm pretty funny)! So without further ado, below are 23 of the 35 cities who have set a clear start and end date for perhaps one of the most important races of our time.
The Low Down
Over the past few weeks, we've been reaching out to the Vision Zero Cities to hear directly from them. We asked them to share their vision for zero in (roughly) ten words or less. Seven cities kindly responded and here's what they had to say:
Bellevue, WA (from their webpage): "Vision Zero instills a more holistic and comprehensive view regarding traffic fatalities and serious injuries: they are not inevitable."
Cambridge, MA: “Making Cambridge safe and equitable for everyone who travels here."
Durham, NC: "Working together, we can achieve zero fatalities on our roadways because every person in our community matters."
Portland, OR: "Portland aims to eliminate traffic deaths and serious injuries by 2025 through equitable and data-driven actions."
San Antonio, TX: "Together, we can achieve zero fatalities on our roadways because every person matters.”
Santa Barbara, CA: "Vision Zero has transformed how we manage our transportation network."
San Diego, CA: "Making our streets and sidewalks safer as we live, work and play."
For those cities who didn't respond, we'd still love to chat (and there's still other opportunities to showcase you on our blog!)
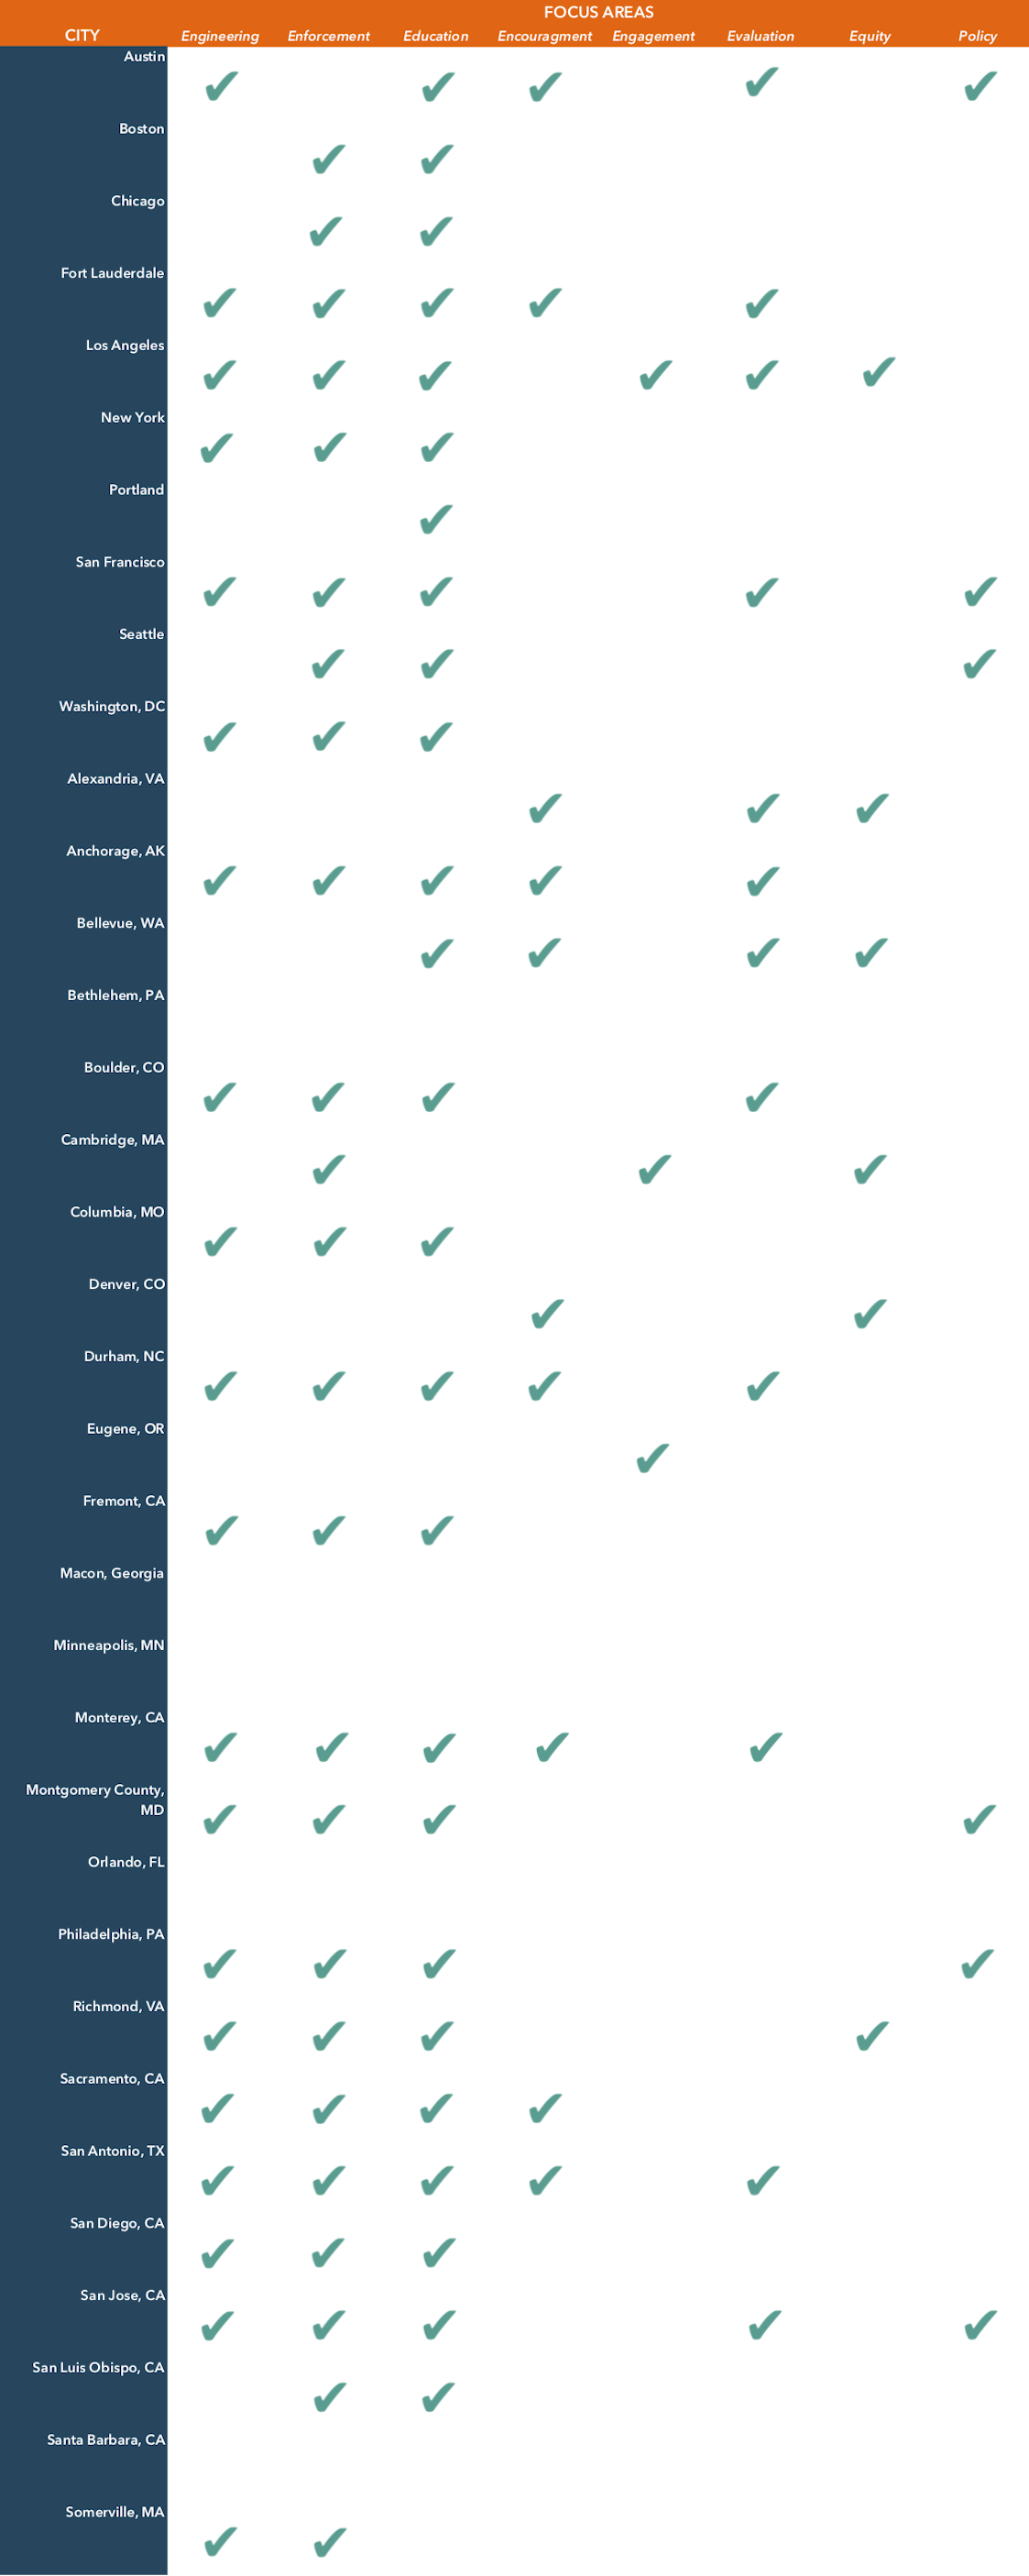
The Drill Down
In true SaaS (software as a service) startup style, we broke down all the "goodies" - Vision Zero strategies - to see how each city's "features" stacked up. Clearly, in this case, you may not necessarily be choosing between each of the cities, but we do hope this helps current Vision Zero Cities - and those that aspire to be - quickly understand what other cities are doing and perhaps borrow from the best (and truly take a page out of the startup handbook!).
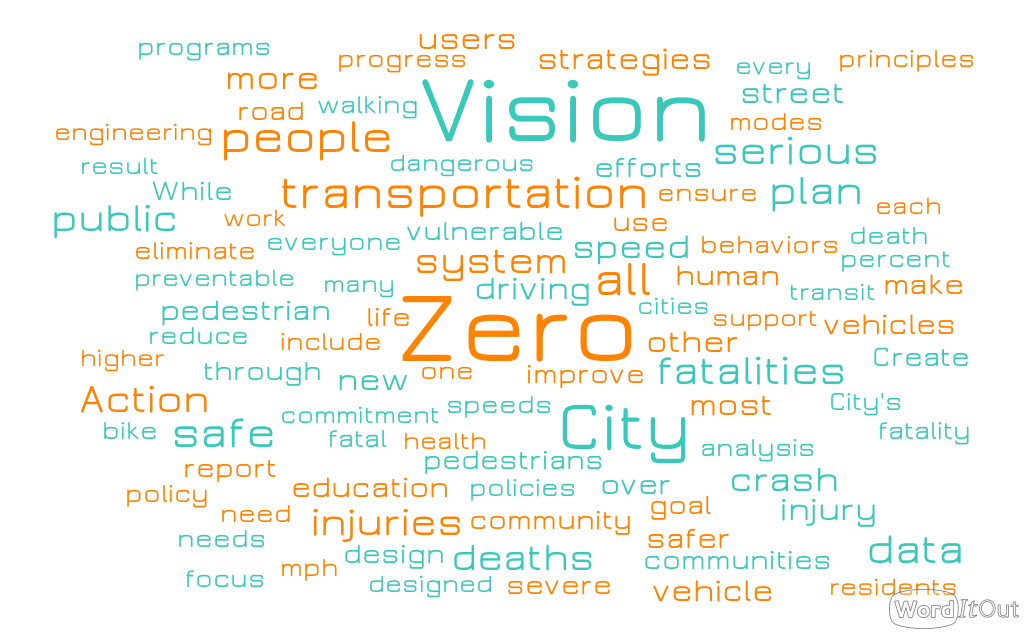
The Common Themes
Ok, so maybe it's like totally 2010s but we still love us some word clouds! And we thought this might actually be an effective way to understand what cities were truly prioritizing (consciously or otherwise) when it came to their Vision Zero strategies. We inputted the executive summaries of all 34 Vision Zeros to see what stood out. And indeed, the good ole' word cloud did not disappoint. As we surmised (and continue to lament), the role of design is pretty diminished in this picture - as is data, despite the fact that it's often highlighted by cities as a key tool to fulfill their aims. Additionally, while thankfully "people" is fairly prominent, "public," "pedestrian," "communities," and "users" are all unacceptably miniscule. And words like engage, participation - heck happy - are conspicuosly absent.
The Long Road Ahead
We thought it was important to clearly lay out the giant undertaking that these courageous cities have taken on. We compiled key stats on the the number of pedestrians (including cyclists) deaths (in 2016), the percentage of collision fatalities that were pedestrians, and the pedestrian fatality rate for 100K population. It was important to include all of these metrics so as to be able to make better comparisons between these cities who vary widely by population and mode share. For example, take the City of Los Angeles, while they had the highest absolute number of pedestrian deaths, the rate of deaths per 100K in population falls in the mid-range for these Vision Zero cities. Additionally, while San Diego and Philadelphia had similar numbers of pedestrian deaths (42 and 43, respectively), Philadelphia's pedestrian mode share of 8.3% is much higher than that of San Diego's at 3.1%, indicating that their streets are more deadly. Note that we were only able to compile this data for 27 of the 35 cities for which data was available and even then, it was incredibly difficult to find this data - and even one city (Orlando) put their data behind a paywall (sorry, we didn't pay on account of it's supposed to be public info!). Anyway, please do dive into the data we did dig up.
Eugene & Fort Lauderdale based on 2014 data; Fremont based on 2015; Richmond based on 2017 data; Sacramento based on average between 2010-2014; Santa Barbara based on average between 2004-2013
The Money
Ok, so we really really tried to get some stats for you guys here but man are cities keeping mum about this - or they just don't really have the budgets needed to support this very important vision. Even based on what we did find, we have to say that for such lofty and important goals as these cities have laid out, many of them do not seem to have the proper funding and/or capacity to see them through (although we here at State of Place - which, as a software, packs the expertise of a consultant without the big price tag - would love to help - in particular because we can help you identify the changes with the biggest impact for the lowest cost!) Here's what we found:
Los Angeles, CA: $3M allocated in 2017 to start the Vision Zero Network; partnering with LADOT
Anchorage, AL: $900K from the Federal Transportation Alternative Program
Boulder, CO: Allocated $150K toward Vision Zero safety initiatives
Cambridge, MA: $304K allocated for various projects related to Vision Zero
Monterey, CA: $198K toward Systematic Safety Analysis Report Program; $184K toward interactive, safety education program
Philadelphia, PA: Continuation of Safe Routes to School grant
Washington, DC: $500K "down payment" from 2016 budget
Denver, CO: Plan to dedicate $2M/year initially
The Team
We are very happy to report that the Vision Zero effort, true to its original ethos, is indeed quite multidisciplinary. Most cities have at least two different departments working on the initiative and many have upwards of 10 or more different departments involved in the effort. Only the City of Durham seems to be going at it alone, with their efforts being led by their DOT. The teamwork that the grand majority of these cities are undertaking is certainly to be lauded, but it's important to be aware of the too many cooks in the kitchen risk. Additionally, cities must work to work together not just in a multidisciplinary way but in a transdisciplinary one in which people get outside of their silos, jargons, and lexicons and truly contribute their varying areas of expertise in a whole is bigger than the sum of its parts kinda way.
Cities - we want you!
So cities - on this list or wishing to be on it - we'd love to hear directly from you about your strategies, what's working and what's not, what you need help with (data anyone?!), what you're most excited about, what keeps you up at night - all of it! Get in touch. We'd love to feature you in our Vision Zero case studies, interview you for our podcast, and/or actually help you use data - and integrate better urban design - into your strategies (in particular to help you prioritize which changes will actually have the biggest impact)...because it's all about getting to zero, together, as fast as we can.