
On Our Own (Two Feet)
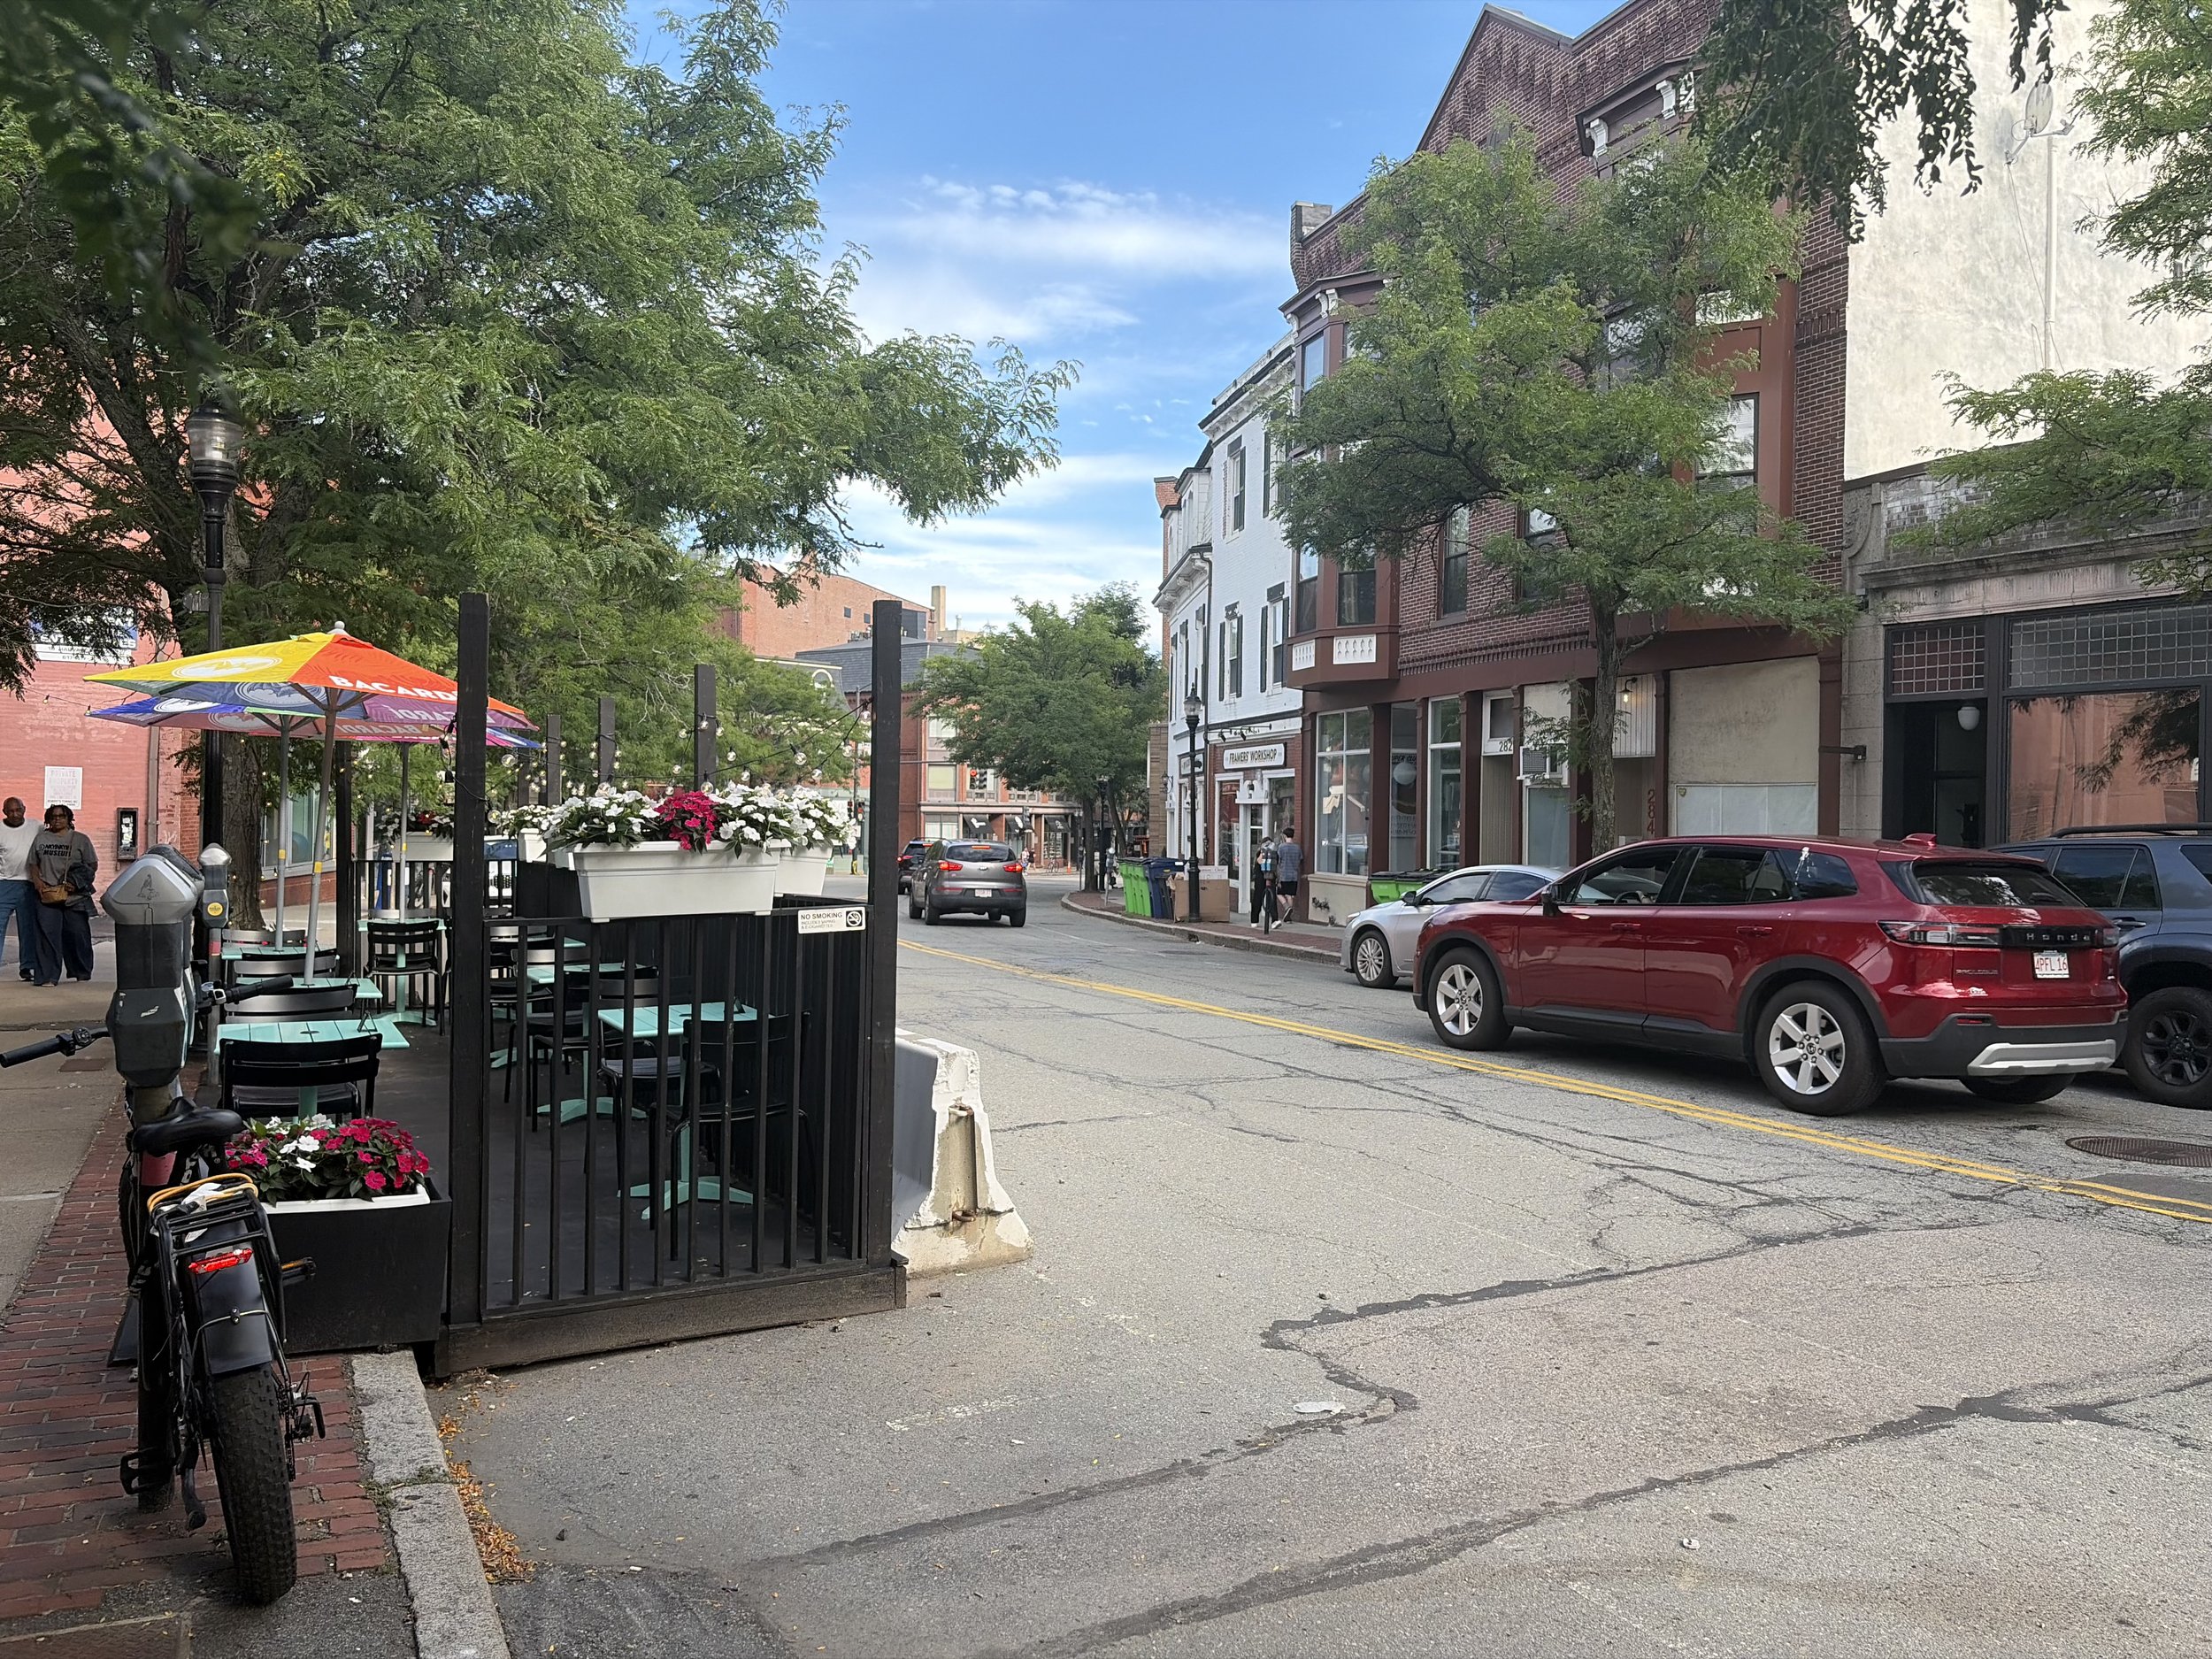
This blog is a sequel to Sebastian Wood’s post On My Own (Two Feet), published on July 7, 2019. Sebastian was a former State of Place blog contributor, and he also happens to be my wonderful older brother. In it, Sebastian described his experiences growing up in our hometown of Brookline. More specifically, he focused on how walking shaped his daily life, and how Brookline’s walkability enabled him to participate in so many community activities, like acting in plays in nearby theatres. He then compared it to his experience at Pitzer College in Claremont, California, where the public transportation and walkability outside of campus were more limited. He concluded that growing up in a walkable environment gave him a real appreciation for well-organized cities and the features that make walking more possible and pleasant.
When I first read Sebastian’s article, I realized how both of our upbringings had shaped our experiences with our built environment. I also benefited from growing up somewhere more walkable, allowing me to visit the park, the movie theater, the comic store, or other places I loved in my hometown – freely and safely. Similarly, I experienced a “rude awakening” of sorts when I moved off-campus at my college, UMass Amherst. I discovered that so many diners, theatres, and stores that I wanted to visit were only accessible by car. My preference for walking over driving made me increasingly aware of the specific built environment features that made some places easier, safer, or more enjoyable to walk through.
State of Place Index Features
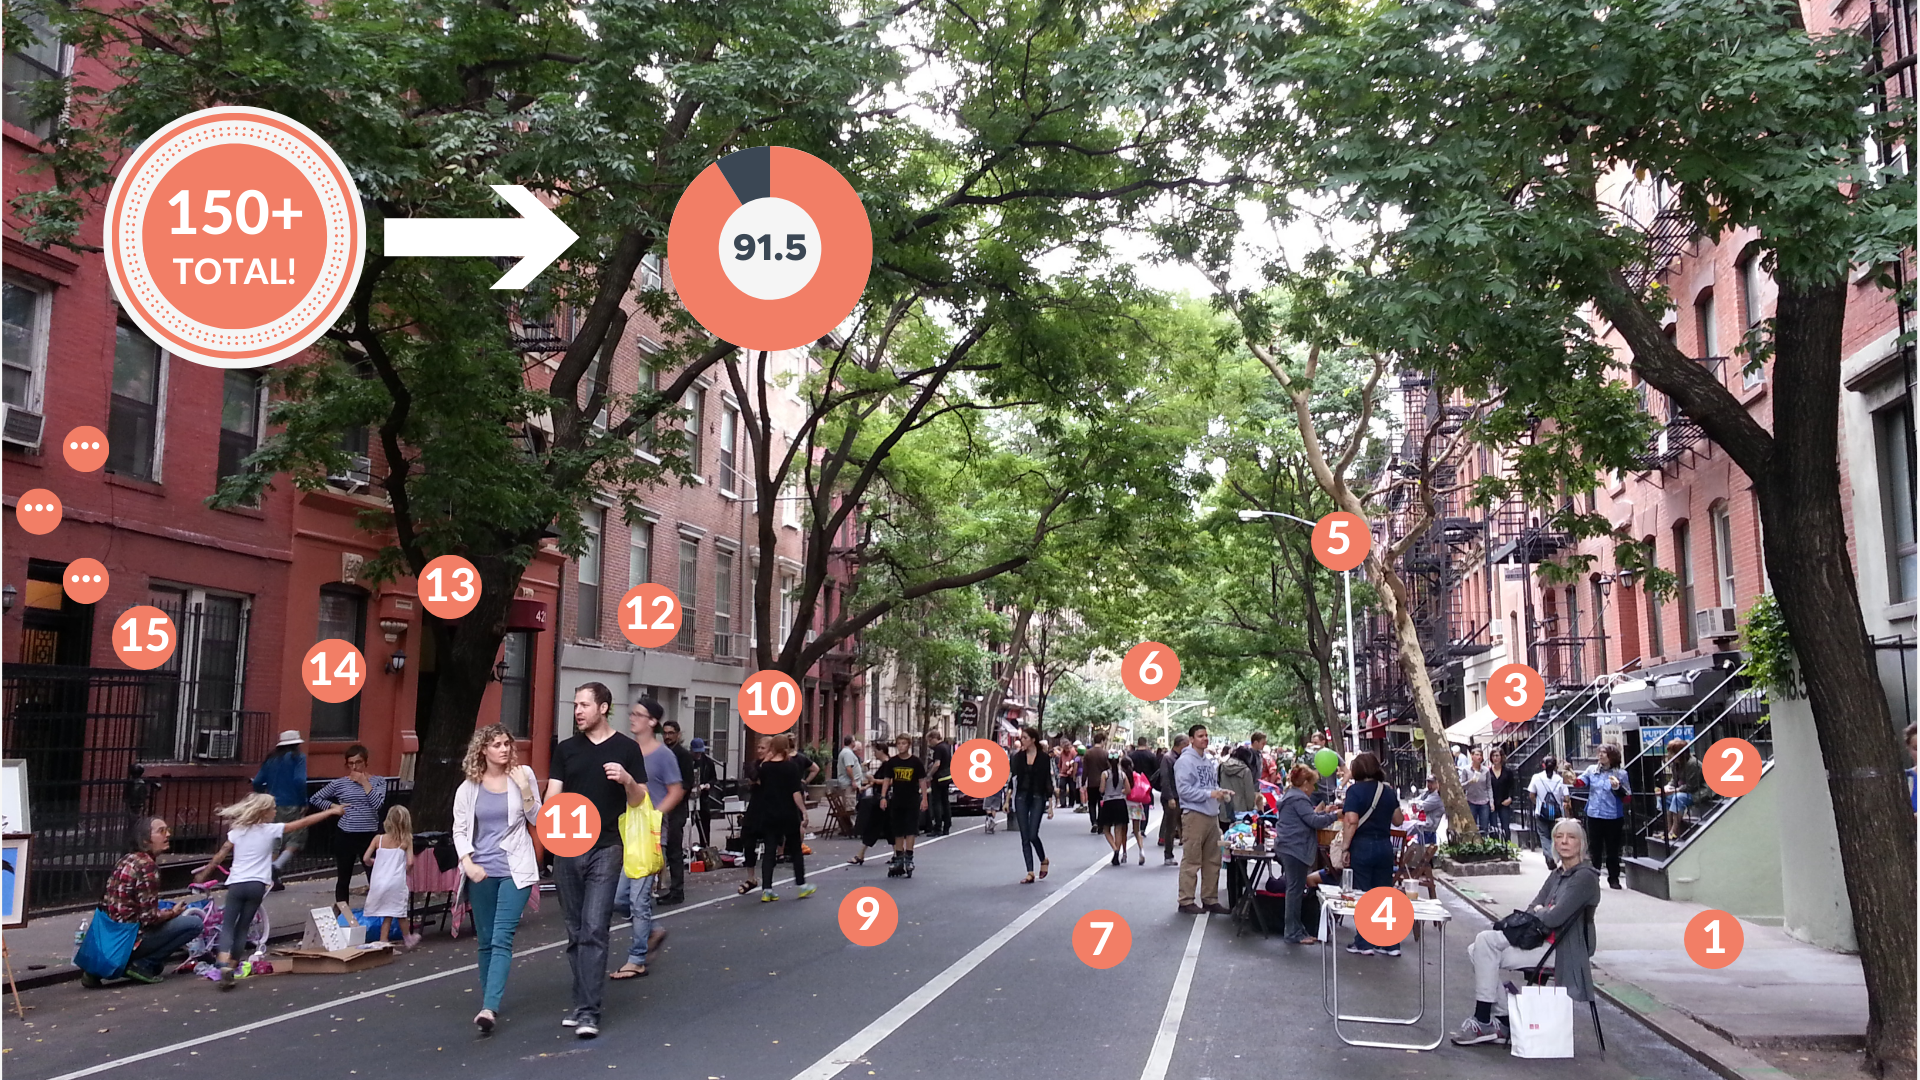
For context, I have been working at State of Place as a marketing and research intern for the last several years. During this time, I have learned how to see walkability not just as a feeling, but as something shaped by specific, measurable built environment features. State of Place evaluates more than 150 of these features, including sidewalks, curb cuts, seating, bus stops, and other street-level amenities, and translates them into the State of Place Index - a validated score from 0-100 that measures built environment quality, including walkability and bikeability, which ultimately helps explain how a place supports people’s daily lives. This made me wonder: would the State of Place data reflect my lived experiences walking through Brookline vs. Amherst?
To test this question, I manually collected State of Place data for streets I regularly walked in both Brookline and Amherst. I limited the analysis to mixed-use streets tied to my daily life, rather than attempting to survey either place in full. This included:
Brookline:
38 Segments
Covering approximately 0.1 square miles within a 1.4-mile perimeter
Around my schools, parks, shops, and the Brookline Hills train station
Amherst:
22 segments
Covering approximately 0.45 square miles within a 3.1-mile perimeter
Along and around streets I used most often near UMass Amherst campus
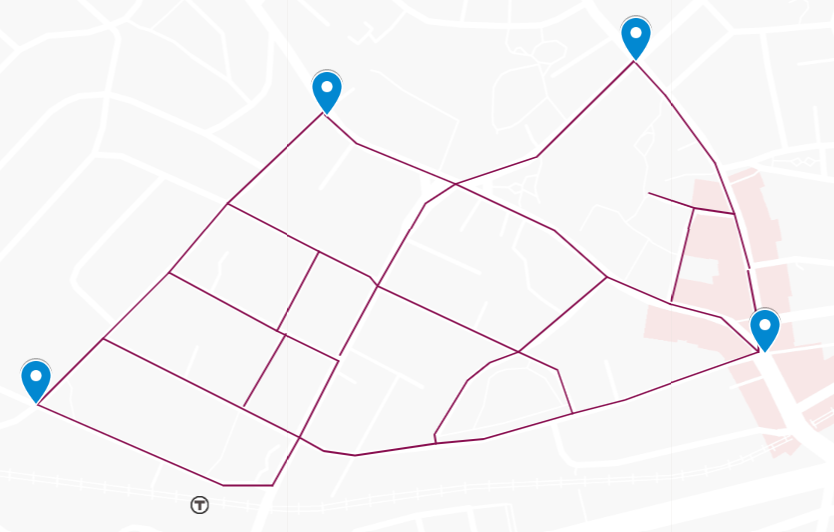
Figure 1: Brookline Data Collection Zone
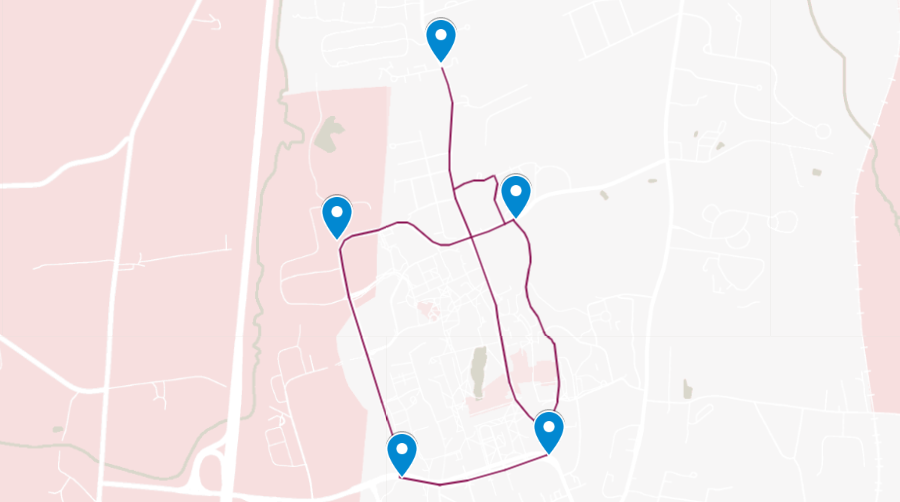
Figure 2: Amherst Data Collection Zone
The State of Place Index Software scored both Brookline and Amherst across all 10 dimensions, plus an overall index score for each. Figures 3 and 4 show the average results for each study area.
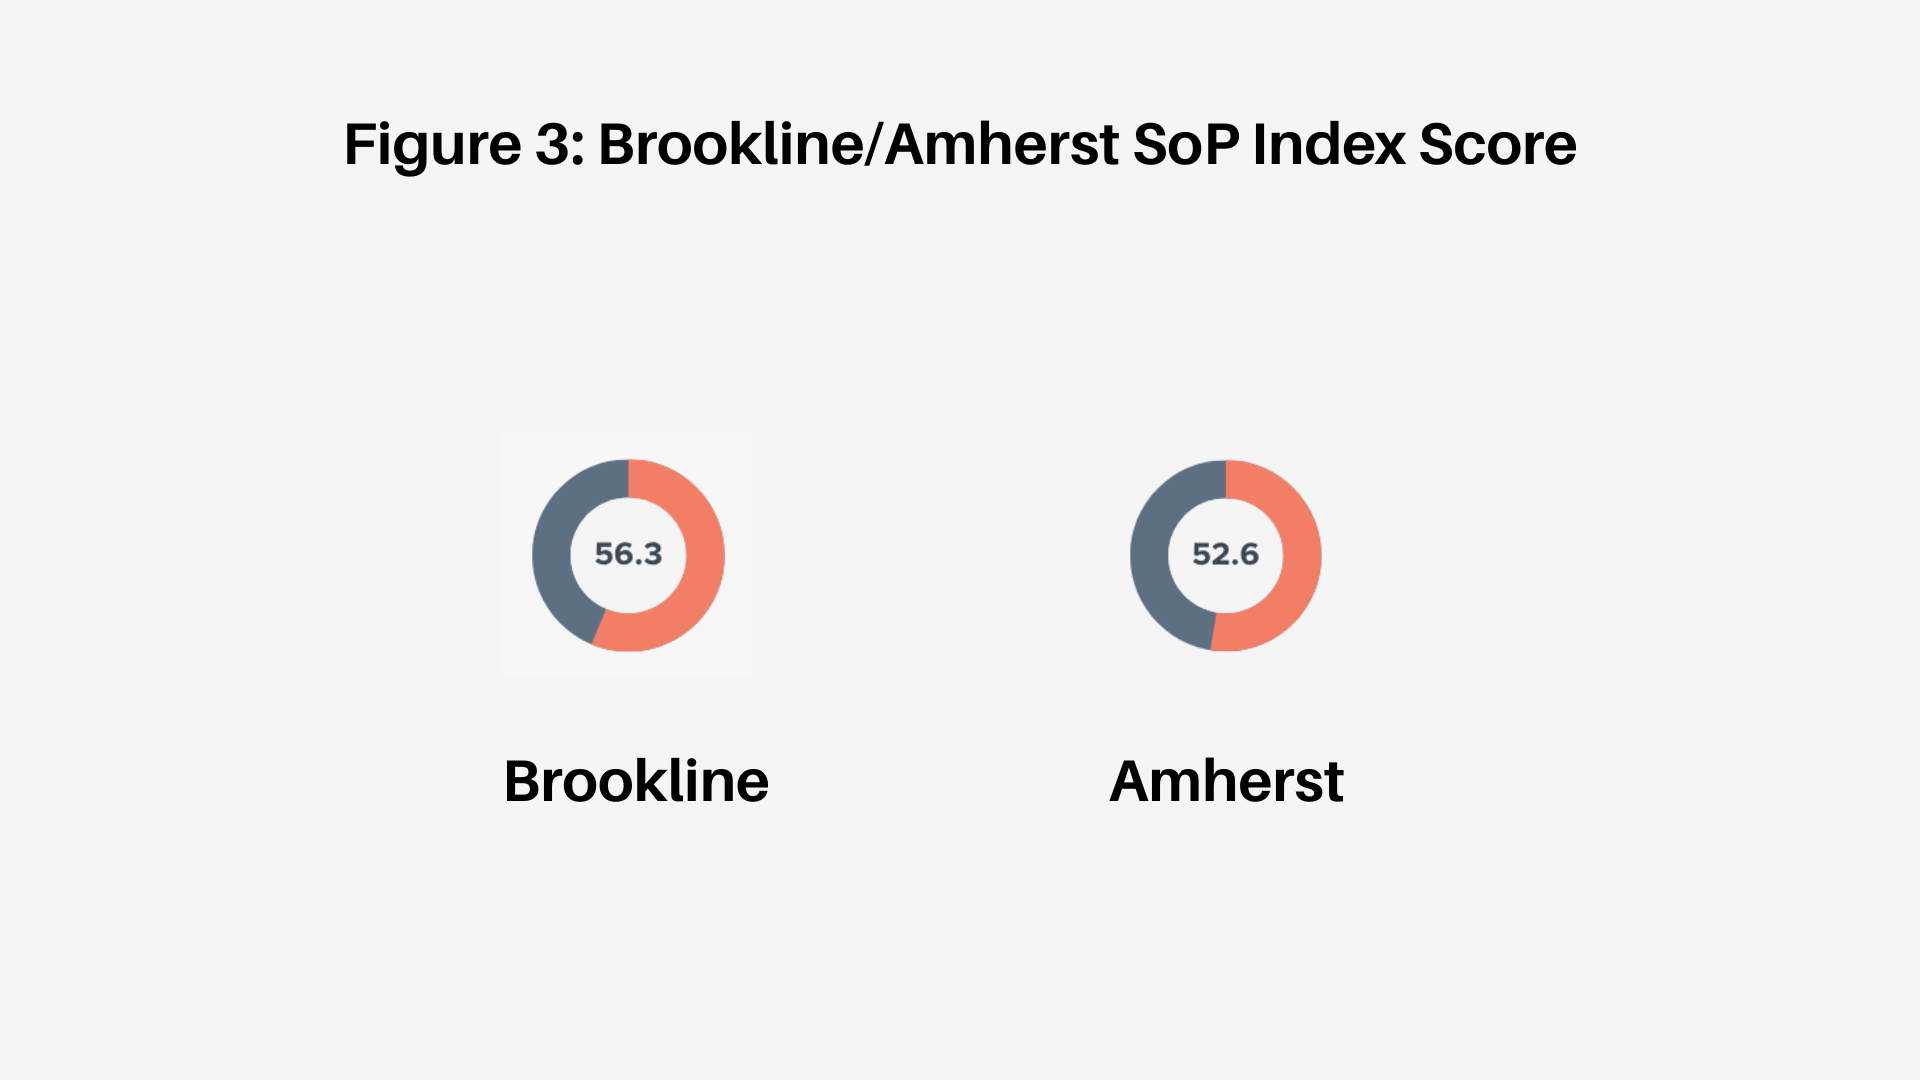
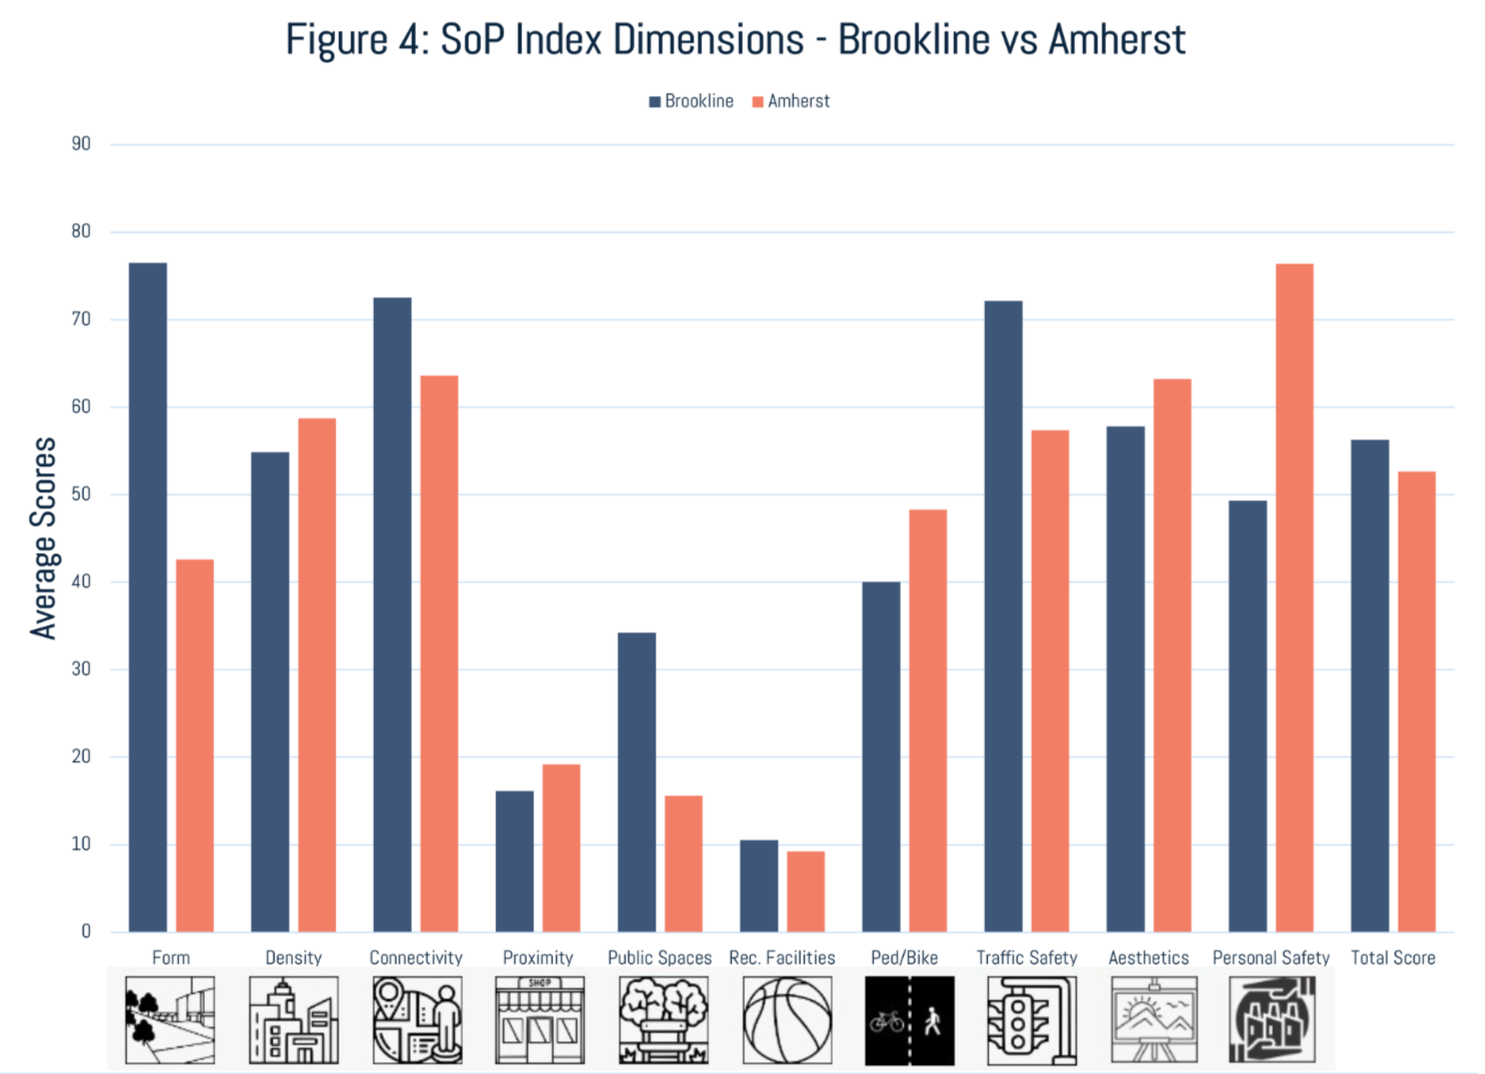
Brookline’s average State of Place Index was 56.3, compared to 52.6 for Amherst, confirming what I had felt in my own daily experience: Brookline offered a more comfortable and supportive walking environment. The largest positive differences appeared in Form (76.5 vs. 42.6), Public Spaces (34.2 vs. 15.6), and Traffic Safety (72.2 vs. 57.4). These gaps reflected the specific features I noticed most while walking: Brookline’s parks, more continuous street walls, and stronger separation between pedestrians and vehicles, compared with the more spread-out and less buffered streets around UMass Amherst.
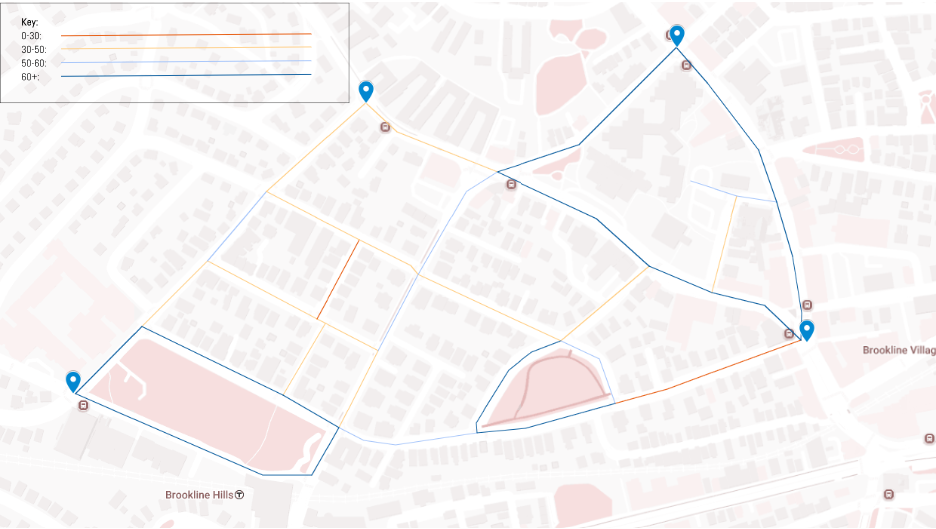
Figure 5: Brookline SoP Index Map
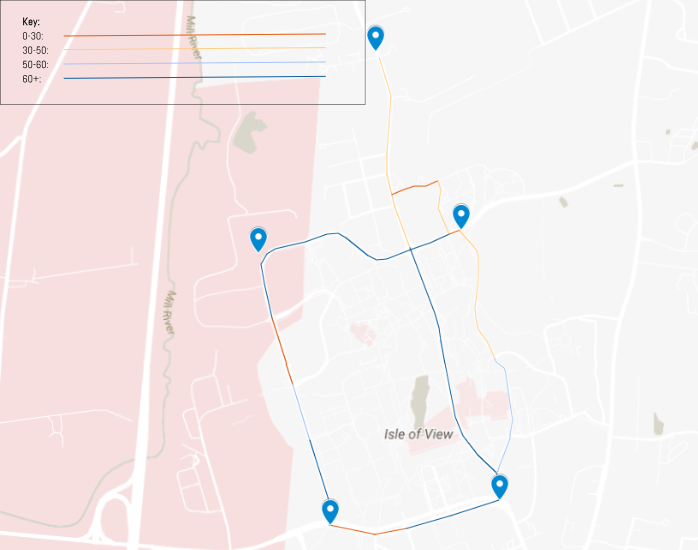
Figure 6: Amherst SoP Index Map
Figures 5 and 6 map the State of Place index score for each individual block in Brookline and Amherst, similar to the 'Explore' function on the State of Place software. At this level, the scores reveal which blocks perform well and which could use more design attention.
The Brookline data helps explain why I was often willing to walk farther to Brookline Village than to closer destinations around the central intersection. The higher-scoring segments clustered around places I naturally gravitated to: Washington Street, Harvard Street, nearby shops, and public parks. These areas offered more of what made walking useful and enjoyable - a mix of destinations, higher density, and more active streets.
The Amherst data showed a similar pattern with a key difference. The higher-scoring segments were the areas where I spent most of my time, while several lower-scoring segments functioned more as pass-through spaces, especially along parts of North Pleasant Street. This also matched my experience: I often noticed the lack of buffers between the sidewalk and moving vehicles, which made those walks feel less safe and comfortable. In Brookline, by contrast, sidewalks in the surveyed area were more often buffered by street trees, parked cars, bollards, or other features. This difference helps explain why Brookline scored higher on Traffic Safety (72.2 vs. 57.4), and why walking there felt better.
Just like Sebastian, the built environment around me shaped my experiences growing up - not just by where I could walk, but by how those walks felt. This analysis showed that those feelings were not just personal preference; they were tied to measurable features of the street, from parks and shops to buffers, density and continuous street walls. The State of Place Index helped explain how better-designed places shaped my behavior - objectively, including why certain streets drew me in while others felt more like pass-through spaces. That matters because the places where people choose to spend time are also the places where social, community, and economic value concentrate. By measuring the features that make streets more walkable, comfortable, and inviting, State of Place can help communities identify gaps, prioritize improvements, and create places where people are more likely to walk, linger, and return.