
Step on the (Place) Scale
C'mon Cities, Let's Achieve Your New Year's Resolutions to Get Walkable, Together!
Ah the new year! A time when we reflect on all that we've accomplished (hopefully!) in the past year, as well as make (sometimes lofty) plans and resolutions for "the new me." But making successful resolutions that stick is hard work...because it involves making changes, which is no easy feat (especially for cities, since that usually means getting others on board too)! Dropping 15 pounds, quitting smoking, organizing your closet, or creating better places (our wheelhouse!) can be difficult without the right tools and support. Although we can't help organize your closet, we can provide cities with an invaluable tool to achieve their place quality resolutions - to help make your neighborhoods and communities more walkable, livable, irresistible. Here's how...
Go Ahead, Step on that Scale
The first step is to understand what you’re starting with - it's like stepping on the scale to find out how much you actually weigh if you're serious about shedding some pounds and getting healthier! The State of Place Index is sort of like stepping on the place quality scale. It helps cities better understand their neighborhoods' strengths and weaknesses by creating a baseline of their place quality and walkability.
OK, How bad is it?
During our countless (and continuing) discussions with cities, developers, planners, investors, designers, and more, we (understandably) get a lot of questions. One of the questions we get the most is - what exactly is a State of Place Index of 70? What does a neighborhood with a State of Place Index of 50 look like? How does that compare to an 80? That question is the same question you should be asking yourself - and answering - before devising your strategies or creating a plan to meet your goal place "weight!"
Now, we are most certainly happy to serve as your "scale" and take your measurements (all 290+ of them) anytime! In the meantime, here's a handy visual guide to help you gauge where you might be starting from in 2017! Below, we have broken down the State of Place Index into five levels of place quality and walkability, profiling one neighborhood in each category. Now, remember, not all 50s, 70s, 80s, etc. are created equally. The State of Place Index is composed of ten urban design dimensions - two neighborhoods with the same Index may have very different State of Place Profiles. This is yet another reason to step on our our "place" scale! and why State of Place, uniquely, isn't a black box. We encourage you to look “under the hood” (ahem, we’re not allowed to use car metaphors here at State of Place, so inside the sole?) and discover your neighborhood’s specific assets and needs.
(After you've scrolled through and "self-diagnosed" where you might be starting from, please see our 4-part prescription for place - your "walkmap" to great places and an awesome 2017!)
State of Place Index 80-100
These “Streets” Are Made for Walking
Neighborhoods with scores from 80 to 100 are very walkable and have a high quality of place. Only 5% of the neighborhoods in our database actually fall into this category. They all tend to have a balanced mix of uses, ample pedestrian amenities, good urban form and connectivity, and are aesthetically pleasing.
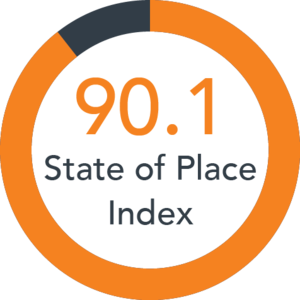
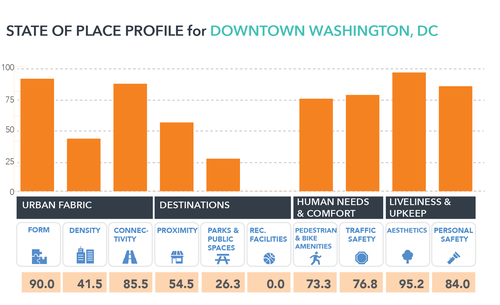
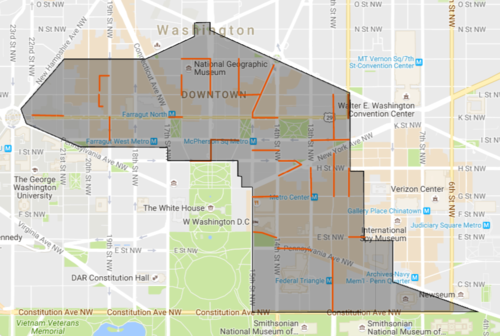
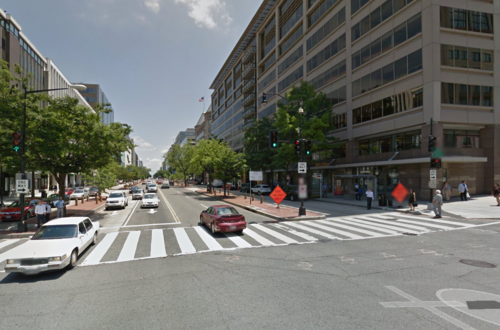
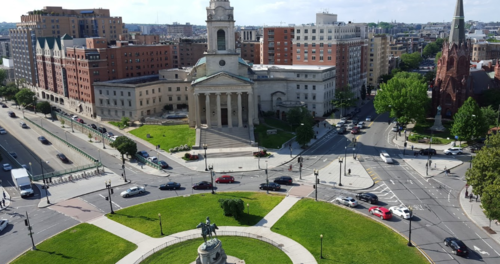
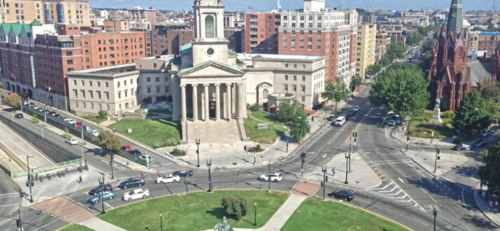
Profiled here is Downtown, Washington, DC, with an overall State of Place Index of 90.1. Most notably, Downtown DC’s historic urban fabric makes it very walkable, albeit it’s relatively less dense than many other neighborhoods we’ve scored, likely due to DC’s height restriction. Additionally, the mix of historic and modern buildings make for an interesting, aesthetically pleasing walking experience. Interestingly, Downtown also scored very well in terms of personal safety, showing how much of a transformation it has gone through over the past three decades. However, there is always room for improvement! Namely, the area wants for a more dynamic mix of destinations as well as more public and green space.
State of Place Index 60-80
Walking on Up
Neighborhoods with scores from 60-80 are still quite walkable as measured by the State of Place Index. They tend to provide good traffic safety, bike and pedestrian amenities, and offer a fairly good range of land uses. As with the highest level of the State of Place index, only a relatively low percentage of neighborhoods - 6.4% - fall within this range.
Clarendon, VA is a quintessential "walkable suburban" downtown. Having undergone a serious walkability “facelift” over the course of more than a decade - perhaps marked by the marquee redevelopment project, Clarendon Commons - the neighborhood offers a very safe pedestrian environment, great connectivity, and nice pedestrian and bike amenities. However, Clarendon can still benefit from a more diverse mix of uses, additional public spaces, and increased building compactness.
State of Place Index 40-60
“Walk” of the Mill
While a score between 40-60 may sound bad, neighborhoods in this range offer average walkability; indeed, the majority of neighborhoods in our database fall within this range. However, given that the average walkability of neighborhoods in the U.S. isn’t that great to begin with, and in light of the increased desire to "live, work, and play" in walkable places, these neighborhoods are ripe for improvement. The State of Place Profile is a critical analysis tool for these kinds of places, as the assets and needs of these neighborhoods vary greatly: some neighborhoods severely lack access to destinations, others have dangerous traffic conditions, and yet others offer few if any pedestrian amenities. Neighborhoods in this range must be examined closely - context is key. There is no walkability panacea or one-size-fits-all approach silver bullet.
Rockville, MD is a good example of the neighborhoods that fall in this category. While it offers good personal safety and is relatively aesthetically pleasing, it has a low number of accessible destinations and offers few pedestrian or bike amenities. That said, the city has taken significant steps to become more walkable, including the development of their $100 million Town Square, which includes a library, an arts center, restaurants, and a new mixed-use project with a hotel, residences, and shopping.
State of Place Index 20-40
Walking the Line
Neighborhoods scoring between 20-40 on the State of Place certainly need some TLC. Comprising about a quarter of the neighborhoods in our database, they typically score well below average on traffic safety, lack pedestrian and bike amenities, and have very few non-residential destinations. Many also have a poor urban fabric. These neighborhoods are fairly car-oriented.
While White Flint, a typical mid-century suburb, currently falls into this category, the city has an ambitious plan to redevelop its now closed mall into a new mixed-use neighborhood. This plan should help boost its currently poor urban form and infuse it with a better mix of uses. To truly make this area more walkable, this redevelopment project needs to also address traffic safety, offer more pedestrian amenities, and improve aesthetics.
State of Place Index 0-20
Walking Alone
Neighborhoods scoring between 0-20 on the State of Place Index are severely lacking in walkability and quality of place. Thankfully, these only comprise 2% of our database. Generally, they score poorly across most of the ten dimensions.
In the case of North Woodbridge, it has very poor urban fabric and very few destinations. It also lacks green or public space, and also scores relatively poorly with respect to aesthetics and personal safety. It is characterized by big boxes, large parking lots, and wide roads, signatures of auto-oriented places. There had been a plan for more compact, mixed-use development for the area, but its status to-date is unknown.
Tipping the Scales...
So, how did you fare? Where do you think you "weigh in?" (Pssst...want to go all in and find out exactly what your place scale says...we can help with that).
Ok, so when you know...then it's time for the hard part...change...
Except that in this case, rather than dieting and exercise to drop the pounds, you have to corral, convince, and justify others to add on the "place muscle!"...You know, make the case for great places. The good news is that rather than having to rely on cooky weight loss books and exercise gimmicks, you have facts and data on your side. In fact, we like to think that we make (place) change easy by creating a data-driven "walkmap" toward better places (the 4-part prescription we promised you):
Diagnose (what you just saw with the State of Place Index and Profile)
Prioritize
Project (emphasis on the ject, i.e., the verb form)
Justify
With our data and evidence, cities can make the case for great places and be empowered to quell the naysayers/NIMBY's and convince decision-makers in a language everyone understands! This is exactly what we did with our recent customer, the City of Tigard in Oregon (full case study coming on the blog)! Last year, their resolution was to become the most walkable city in the Pacific Northwest and they worked with us to make (strategic) progress toward this goal.
So just like with Tigard, once we pin down your city's State of Place Index and Profile, the next step is to set priorities. Yes, you want to increase place quality, but what goals are you trying to achieve by doing so? Increase actual walking? Rental values? Property tax bases? And what resources do you have to achieve them? Can you change your zoning easily? Do you have a capital improvement budget? Are you starting a new development from scratch? The answers to all of these questions influence where and how you should start "bulking" up your place quality. Our platform generates evidence-based urban design priorities and recommendations based on your answers to these questions.
You can then run different design scenarios, planning schemes, or even play with adjusting several existing built environment features to project the impact it would have on the State of Place Index & Profile and put a number where your words (and pictures) are, to, as one of our customers put it, "bring a gun to the gunfight" in the battle for great places. And finally, when dealing with folks who are specifically interested in the economic bottom line numbers, you can forecast the premiums, value-capture, and ROI of those scenarios - and corral, convince, justify your New Year's resolution to make better places and be equipped to add on that "place muscle" anytime!
If you are interested in learning more about creating more walkable, livable places, please preview our software and schedule a time to talk with us about your goals and how we might be able to help you. You can also visit our data geeks section to learn more about the scoring process itself. We would love to help you achieve your place quality & walkability New Year's resolutions for 2017!
*All Street Pictures from ©Google Street View